Blackberry 2016 Annual Report Download - page 131
Download and view the complete annual report
Please find page 131 of the 2016 Blackberry annual report below. You can navigate through the pages in the report by either clicking on the pages listed below, or by using the keyword search tool below to find specific information within the annual report.-
 1
1 -
2
-
3
-
4
-
5
-
6
-
7
-
8
-
9
-
10
-
11
-
12
-
13
-
14
-
15
-
16
-
17
-
18
-
19
-
20
-
21
-
22
-
23
-
24
-
25
-
26
-
27
-
28
-
29
-
30
-
31
-
32
-
33
-
34
-
35
-
36
-
37
-
38
-
39
-
40
-
41
-
42
-
43
-
44
-
45
-
46
-
47
-
48
-
49
-
50
-
51
-
52
-
53
-
54
-
55
-
56
-
57
-
58
-
59
-
60
-
61
-
62
-
63
-
64
-
65
-
66
-
67
-
68
-
69
-
70
-
71
-
72
-
73
-
74
-
75
-
76
-
77
-
78
-
79
-
80
-
81
-
82
-
83
-
84
-
85
-
86
-
87
-
88
-
89
-
90
-
91
-
92
-
93
-
94
-
95
-
96
-
97
-
98
-
99
-
100
-
101
-
102
-
103
-
104
-
105
-
106
-
107
-
108
-
109
-
110
-
111
-
112
-
113
-
114
-
115
-
116
-
117
-
118
-
119
-
120
-
 121
121 -
 122
122 -
 123
123 -
 124
124 -
 125
125 -
 126
126 -
 127
127 -
 128
128 -
 129
129 -
 130
130 -
 131
131 -
 132
132 -
 133
133 -
 134
134 -
 135
135 -
 136
136 -
 137
137 -
 138
138
 |
 |

BlackBerry Limited
Management’s Discussion and Analysis of Financial Condition and Results of Operations
23
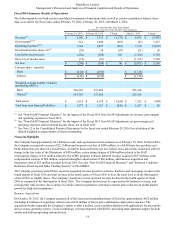
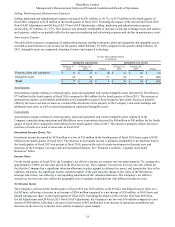
Operating Expenses
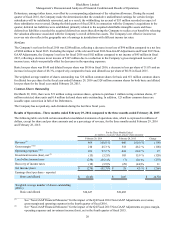
The table below presents a comparison of research and development, selling, marketing and administration, and amortization
expenses for the quarter ended February 29, 2016, compared to the quarter ended November 28, 2015 and the quarter ended
February 28, 2015. The Company believes it is meaningful to also provide a comparison between the fourth quarter of fiscal
2016 and the third quarter of fiscal 2016 given that the Company’s quarterly operating results vary substantially.
For the Three Months Ended
(in millions)
February 29, 2016 November 28, 2015 February 28, 2015
% of
Revenue % of
Revenue % of
Revenue
Revenue(1)(2) $ 464 $ 548 $ 660
Operating expenses
Research and development(1)(2)(3) 108 23.3 % 100 18.2 % 134 20.3%
Selling, marketing and administration(1)(2)(3) 179 38.6 % 175 31.9 % 138 20.9%
Amortization(1)(2)(3) 77 16.6 % 68 12.4 % 68 10.3%
Abandonment/impairment of long-lived
assets 127 27.4 % 2 0.4 % 34 5.2%
Debentures fair value adjustment(1)(2)(3) (40) (8.6)% (5) (0.9)% 50 7.6%
Total $ 451 97.2 % $ 340 62.0 % $ 424 64.2%
_________________________
(1) See “Non-GAAP Financial Measures” for the impact of the Q4 Fiscal 2016 Non-GAAP Adjustments on revenue and
operating expenses in the fourth quarter of fiscal 2016.
(2) In the third quarter of fiscal 2016, the Company had software deferred revenue acquired but not recognized due to
business combination accounting rules of approximately $9 million, recorded non-cash income associated with a
change in the fair value of the Debentures of approximately $5 million, RAP charges of approximately $2 million and
$26 million in research and development and selling, marketing and administration expenses, respectively, CORE
program recoveries of approximately $6 million in selling, marketing and administration expenses, stock
compensation expense of approximately $4 million and $10 million in research and development and selling,
marketing and administration expenses, respectively, amortization of intangible assets acquired through business
combinations of approximately $18 million in amortization expense, and business acquisition and integration costs
incurred through business combinations of approximately $11 million in selling, marketing and administration
expense (collectively the “Q3 Fiscal 2016 Non-GAAP Adjustments”).
(3) See “Non-GAAP Financial Measures” for the impact of the Q4 Fiscal 2015 Non-GAAP Adjustments on operating
expenses in the fourth quarter of fiscal 2015.
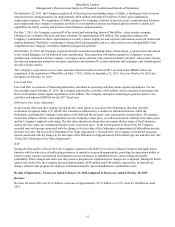
Operating expenses increased by $111 million, or 32.6%, to $451 million, or 97.2% of revenue, in the fourth quarter of fiscal
2016, compared to $340 million, or 62.0% of revenue, in the third quarter of fiscal 2016. Excluding the impact of the relevant
Q4 Fiscal 2016 Non-GAAP Adjustments and Q3 Fiscal 2016 Non-GAAP Adjustments, operating expenses decreased by $22
million, or 7.9%. The decrease was primarily attributable to decreases in marketing, advertising and legal costs, partially offset
by increases in foreign exchange losses and external advisory fees.
Operating expenses increased by $27 million, or 6.4%, to $451 million, or 97.2% of revenue, in the fourth quarter of fiscal
2016, compared to $424 million, or 64.2% of revenue, in the fourth quarter of fiscal 2015. Excluding the impact of the relevant
Q4 Fiscal 2016 Non-GAAP Adjustments and Q4 Fiscal 2015 Non-GAAP Adjustments, operating expenses decreased by $36
million, or 12.2%. This decrease was primarily attributable to decreases in marketing, advertising and salaries and benefits
costs, partially offset by increases in foreign exchange losses compared to the fourth quarter of fiscal 2015.
Research and Development Expense
Research and development expenses decreased by $26 million, or 19.4% to $108 million in the fourth quarter of fiscal 2016
compared to $134 million in the fourth quarter of fiscal 2015. Excluding the impact of the relevant Q4 Fiscal 2016 Non-GAAP
Adjustments and Q4 Fiscal 2015 Non-GAAP Adjustments, research and development expenses decreased by $39 million, or
31.5%. This decrease was primarily attributable to decreases in salaries and benefits costs and reductions in materials and
outsourcing costs.