Blackberry 2016 Annual Report Download - page 129
Download and view the complete annual report
Please find page 129 of the 2016 Blackberry annual report below. You can navigate through the pages in the report by either clicking on the pages listed below, or by using the keyword search tool below to find specific information within the annual report.-
 1
1 -
2
-
3
-
4
-
5
-
6
-
7
-
8
-
9
-
10
-
11
-
12
-
13
-
14
-
15
-
16
-
17
-
18
-
19
-
20
-
21
-
22
-
23
-
24
-
25
-
26
-
27
-
28
-
29
-
30
-
31
-
32
-
33
-
34
-
35
-
36
-
37
-
38
-
39
-
40
-
41
-
42
-
43
-
44
-
45
-
46
-
47
-
48
-
49
-
50
-
51
-
52
-
53
-
54
-
55
-
56
-
57
-
58
-
59
-
60
-
61
-
62
-
63
-
64
-
65
-
66
-
67
-
68
-
69
-
70
-
71
-
72
-
73
-
74
-
75
-
76
-
77
-
78
-
79
-
80
-
81
-
82
-
83
-
84
-
85
-
86
-
87
-
88
-
89
-
90
-
91
-
92
-
93
-
94
-
95
-
96
-
97
-
98
-
99
-
100
-
101
-
102
-
103
-
104
-
105
-
106
-
107
-
108
-
109
-
110
-
111
-
112
-
113
-
114
-
115
-
116
-
117
-
118
-
 119
119 -
 120
120 -
 121
121 -
 122
122 -
 123
123 -
 124
124 -
 125
125 -
 126
126 -
 127
127 -
 128
128 -
 129
129 -
 130
130 -
 131
131 -
 132
132 -
 133
133 -
 134
134 -
 135
135 -
 136
136 -
 137
137 -
 138
138
 |
 |

BlackBerry Limited
Management’s Discussion and Analysis of Financial Condition and Results of Operations
21
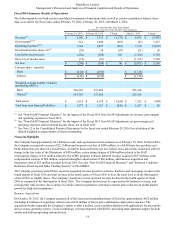
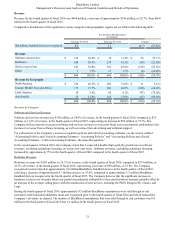
Revenue
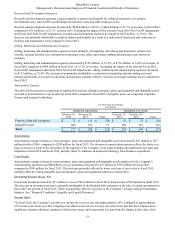
Revenue for the fourth quarter of fiscal 2016 was $464 million, a decrease of approximately $196 million, or 29.7%, from $660
million in the fourth quarter of fiscal 2015.
Comparative breakdowns of the significant revenue categories and geographic regions are set forth in the following table:
For the Three Months Ended
(in millions)
February 29, 2016 February 28, 2015 Change
BlackBerry handheld devices recognized 0.6 1.3 (0.7) (53.8)%
Revenue
Software and services $ 130 28.0% $ 74 11.2% $ 56 75.7 %
Hardware 184 39.7% 274 41.5% (90) (32.8)%
Service access fees 143 30.8% 301 45.6% (158) (52.5)%
Other 7 1.5% 11 1.7% (4) (36.4)%
$ 464 100.0% $ 660 100.0% $ (196) (29.7)%
Revenue by Geography
North America $ 216 46.5% $ 205 31.0% $ 11 5.4 %
Europe, Middle East and Africa 175 37.7% 283 42.9% (108) (38.2)%
Latin America 18 3.9% 60 9.1% (42) (70.0)%
Asia Pacific 55 11.9% 112 17.0% (57) (50.9)%
$ 464 100.0% $ 660 100.0% $ (196) (29.7)%
Revenue by Category
Software and Services Revenue
Software and services revenue was $130 million, or 28.0% of revenue, in the fourth quarter of fiscal 2016, compared to $74
million, or 11.2% of revenue, in the fourth quarter of fiscal 2015, representing an increase of $56 million or 75.7%. The
Company believes that the increase in software and services revenue over the prior fiscal year was primarily attributable to the
increase in revenue from software licensing, as well as revenue from advertising and technical support.
For a discussion of the Company’s revenue recognition policies and critical accounting estimates, see the section entitled
“Accounting Policies and Critical Accounting Estimates - Accounting Policies” and “Accounting Policies and Critical
Accounting Estimates - Critical Accounting Estimates - Revenue Recognition.”
In the second quarter of fiscal 2016, the Company stated that it expected a double-digit quarterly growth rate in software
revenues, excluding technology licensing, on a year-over-year basis. Software revenues, excluding technology licensing,
increased by approximately 75% in the fourth quarter of fiscal 2016 compared to the fourth quarter of fiscal 2015.
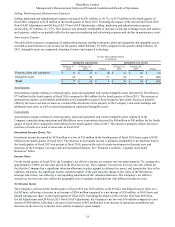
Hardware Revenue
Hardware revenue was $184 million, or 39.7% of revenue, in the fourth quarter of fiscal 2016, compared to $274 million, or
41.5% of revenue, in the fourth quarter of fiscal 2015, representing a decrease of $90 million, or 32.8%. The Company
recognized revenue related to approximately 0.6 million BlackBerry handheld devices in the fourth quarter of fiscal 2016,
reflecting a decrease of approximately 0.7 million devices, or 53.8%, compared to approximately 1.3 million BlackBerry
handheld devices recognized in the fourth quarter of fiscal 2015. The Company believes that the significant decrease in
hardware revenue over the prior fiscal year period was primarily attributable to decreased hardware demand, partially offset by
an increase in the average selling prices with the introduction of new devices, including the PRIV, Passport SE, Classic, and
Leap.
During the fourth quarter of fiscal 2016, approximately 0.7 million BlackBerry smartphones were sold through to end
customers, which included shipments made and recognized prior to the fourth quarter of fiscal 2016 and which reduced the
Company’s inventory in channel. The number of BlackBerry smartphones that were sold through to end customers was 0.9
million in the third quarter of fiscal 2016 and 1.6 million in the fourth quarter of fiscal 2015.