Blackberry 2016 Annual Report Download - page 132
Download and view the complete annual report
Please find page 132 of the 2016 Blackberry annual report below. You can navigate through the pages in the report by either clicking on the pages listed below, or by using the keyword search tool below to find specific information within the annual report.-
 1
1 -
2
-
3
-
4
-
5
-
6
-
7
-
8
-
9
-
10
-
11
-
12
-
13
-
14
-
15
-
16
-
17
-
18
-
19
-
20
-
21
-
22
-
23
-
24
-
25
-
26
-
27
-
28
-
29
-
30
-
31
-
32
-
33
-
34
-
35
-
36
-
37
-
38
-
39
-
40
-
41
-
42
-
43
-
44
-
45
-
46
-
47
-
48
-
49
-
50
-
51
-
52
-
53
-
54
-
55
-
56
-
57
-
58
-
59
-
60
-
61
-
62
-
63
-
64
-
65
-
66
-
67
-
68
-
69
-
70
-
71
-
72
-
73
-
74
-
75
-
76
-
77
-
78
-
79
-
80
-
81
-
82
-
83
-
84
-
85
-
86
-
87
-
88
-
89
-
90
-
91
-
92
-
93
-
94
-
95
-
96
-
97
-
98
-
99
-
100
-
101
-
102
-
103
-
104
-
105
-
106
-
107
-
108
-
109
-
110
-
111
-
112
-
113
-
114
-
115
-
116
-
117
-
118
-
119
-
120
-
121
-
 122
122 -
 123
123 -
 124
124 -
 125
125 -
 126
126 -
 127
127 -
 128
128 -
 129
129 -
 130
130 -
 131
131 -
 132
132 -
 133
133 -
 134
134 -
 135
135 -
 136
136 -
 137
137 -
 138
138
 |
 |
BlackBerry Limited
Management’s Discussion and Analysis of Financial Condition and Results of Operations
24
Selling, Marketing and Administration Expenses
Selling, marketing and administration expenses increased by $41 million, or 29.7%, to $179 million in the fourth quarter of
fiscal 2016 compared to $138 million in the fourth quarter of fiscal 2015. Excluding the impact of the relevant Q4 Fiscal 2016
Non-GAAP Adjustments and Q4 Fiscal 2015 Non-GAAP Adjustments, selling, marketing and administration expenses
increased by $13 million, or 11.7%. This increase was primarily attributable to increases in foreign exchange losses and salaries
and expenses, which were partially offset by decreases in marketing and advertising expenses and decline in maintenance costs.
Amortization Expense
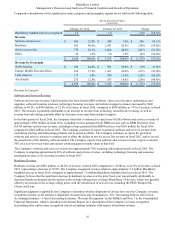
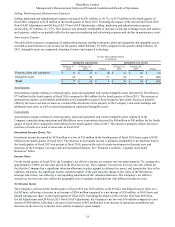
The table below presents a comparison of amortization expense relating to property, plant and equipment and intangible assets
recorded as amortization or cost of sales for the quarter ended February 29, 2016 compared to the quarter ended February 28,
2015. Intangible assets are comprised of patents, licenses and acquired technology.
For the Three Months Ended
(in millions)
Included in Amortization Included in Cost of sales
February 29,
2016 February 28,
2015 Change February 29,
2016 February 28,
2015 Change
Property, plant and equipment $ 15 $ 23 $ (8) $ 12 $ 16 $ (4)
Intangible assets 62 45 17 38 78 (40)
Total $ 77 $ 68 $ 9 $ 50 $ 94 $ (44)
Amortization
Amortization expense relating to certain property, plant and equipment and certain intangible assets increased by $9 million to
$77 million for the fourth quarter of fiscal 2016 compared to $68 million for the fourth quarter of fiscal 2015. The increase in
amortization expense was primarily attributable to the intangibles acquired from businesses previously discussed, partially
offset by the lower cost base of assets as a result of the divestiture of the majority of the Company’s real estate holdings and
additional asset sales, as well as reduced spending on capital and intangible assets.
Cost of sales
Amortization expense relating to certain property, plant and equipment and certain intangible assets employed in the
Company’s manufacturing operations and BlackBerry service operations decreased by $44 million to $50 million for the fourth
quarter of fiscal 2016 compared to $94 million for the fourth quarter of fiscal 2015. This decrease primarily reflects the lower
cost base of assets as a result of asset sales in fiscal 2015.
Investment Income (Loss), Net
Investment income decreased by $120 million to a loss of $15 million in the fourth quarter of fiscal 2016 from a gain of $105
million in the fourth quarter of fiscal 2015. The decrease in investment income is primarily attributable to the Rockstar Sale in
the fourth quarter of fiscal 2015 not present in fiscal 2016, gains on the sale of certain investments in the prior year, and
decreases in the Company’s average cash and investment balances. See “Financial Condition - Liquidity and Capital
Resources” below.
Income Taxes
For the fourth quarter of fiscal 2016, the Company’s net effective income tax expense rate was approximately 7%, compared to
approximately 2,900% for the same period in the prior fiscal year. The Company’s income tax recovery rate also reflects the
fact that the Company has a significant valuation allowance in place against its deferred tax assets, and in particular, due to this
valuation allowance, the significant income statement impact of the gain from the change in fair value of the Debentures,
amongst other items, was offset by a corresponding adjustment of the valuation allowance. The Company’s net effective
income tax recovery rate also reflects the geographic mix of earnings in jurisdictions with different income tax rates.
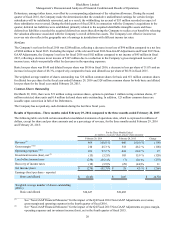
Net Income (Loss)
The Company’s net loss for the fourth quarter of fiscal 2016 was $238 million, or $0.45 basic and diluted loss per share on a
GAAP basis, reflecting a decrease in net income of $266 million compared to a net income of $28 million, or $0.05 basic and
diluted earnings per share, in the fourth quarter of fiscal 2015. Excluding the impact of the relevant Q4 Fiscal 2016 Non-
GAAP Adjustments and Q4 Fiscal 2015 Non-GAAP Adjustments, the Company’s net loss was $18 million compared to a net
income of $44 million, reflecting a decrease in net income of $62 million due to an increase in operating expenditures and
decreases in the recovery of income taxes and the Company’s gross margin.