Blackberry 2016 Annual Report Download - page 116
Download and view the complete annual report
Please find page 116 of the 2016 Blackberry annual report below. You can navigate through the pages in the report by either clicking on the pages listed below, or by using the keyword search tool below to find specific information within the annual report.-
 1
1 -
2
-
3
-
4
-
5
-
6
-
7
-
8
-
9
-
10
-
11
-
12
-
13
-
14
-
15
-
16
-
17
-
18
-
19
-
20
-
21
-
22
-
23
-
24
-
25
-
26
-
27
-
28
-
29
-
30
-
31
-
32
-
33
-
34
-
35
-
36
-
37
-
38
-
39
-
40
-
41
-
42
-
43
-
44
-
45
-
46
-
47
-
48
-
49
-
50
-
51
-
52
-
53
-
54
-
55
-
56
-
57
-
58
-
59
-
60
-
61
-
62
-
63
-
64
-
65
-
66
-
67
-
68
-
69
-
70
-
71
-
72
-
73
-
74
-
75
-
76
-
77
-
78
-
79
-
80
-
81
-
82
-
83
-
84
-
85
-
86
-
87
-
88
-
89
-
90
-
91
-
92
-
93
-
94
-
95
-
96
-
97
-
98
-
99
-
100
-
101
-
102
-
103
-
104
-
105
-
 106
106 -
 107
107 -
 108
108 -
 109
109 -
 110
110 -
 111
111 -
 112
112 -
 113
113 -
 114
114 -
 115
115 -
 116
116 -
 117
117 -
 118
118 -
 119
119 -
 120
120 -
 121
121 -
 122
122 -
 123
123 -
 124
124 -
 125
125 -
 126
126 -
127
-
128
-
129
-
130
-
131
-
132
-
133
-
134
-
135
-
136
-
137
-
138
 |
 |

BlackBerry Limited
Management’s Discussion and Analysis of Financial Condition and Results of Operations
8
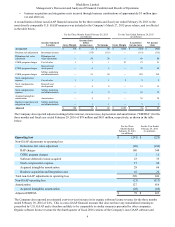
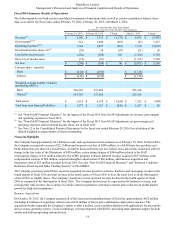
Fiscal 2016 Non-GAAP Adjustments For the Year Ended February 29, 2016
(in millions)
Income statement
location Gross margin
(before taxes)
Gross margin
% (before
taxes) Loss before
income taxes Net loss Basic loss per
share
As reported $ 941 43.6% $ (282) $ (208) $ (0.40)
Debentures fair value adjustment(1) Debentures fair value
adjustment — —% (430) (430)
RAP charges (2) Cost of sales 44 2.0% 44 44
RAP charges (2) Research and
development — —% 47 47
RAP charges (2) Selling, marketing and
administration — —% 253 253
CORE program charges Research and
development — —% 2 2
CORE program charges Selling, marketing and
administration — —% 9 9
Software deferred revenue acquired Revenue(3) 33 0.9% 33 33
Stock compensation expense Cost of sales 1 0.01% 1 1
Stock compensation expense Research and
development — —% 17 17
Stock compensation expense Selling, marketing and
administration — —% 42 42
Acquired intangibles amortization Amortization — —% 66 66
Business acquisition and
integration costs Selling, marketing and
administration — —% 22 22
Adjusted $ 1,019 46.5% $ (176) $ (102) $ (0.19)
______________________________
(1) See “Fiscal 2016 Summary Results of Operations - Financial Highlights - Debentures Fair Value Adjustment”.
(2) See “Fiscal 2016 Summary Results of Operations - Financial Highlights - RAP”.
(3) Included within Software and Services revenue.
Similarly, on March 27, 2015, the Company announced financial results for the three months and fiscal year ended
February 28, 2015, which included certain non-GAAP financial measures, including adjusted gross margin, adjusted income
(loss) before income taxes and adjusted net income (loss).
For the three months ended February 28, 2015, these measures were adjusted for the following (collectively, the “Q4 Fiscal
2015 Non-GAAP Adjustments”):
• the Rockstar patent portfolio sale (“Rockstar Sale”) of approximately $115 million (pre-tax and after tax);
• the Debentures fair value adjustment of approximately $50 million (pre-tax and after tax);
• CORE program charges of approximately $58 million pre-tax ($57 million after tax);
• stock compensation expense of approximately $14 million (pre-tax and after tax);
• amortization of intangible assets acquired through business combinations of approximately $9 million (pre-tax and
after tax); and
• business acquisition and integration costs incurred through business combinations of approximately $1 million (pre-
tax and after tax).
For the fiscal year ended February 28, 2015, these measures were adjusted for the following (collectively, the “Fiscal 2015
Non-GAAP Adjustments”):
• the Rockstar Sale of approximately $115 million (pre-tax and after tax);
• the Debentures fair value adjustment of approximately $80 million (pre-tax and after tax);
• CORE program charges of approximately $322 million pre-tax ($294 million after tax);
• stock compensation expense of approximately $49 million (pre-tax and after tax);
• amortization of intangible assets acquired through business combinations of approximately $38 million (pre-tax and
after tax); and