Blackberry 2016 Annual Report Download - page 122
Download and view the complete annual report
Please find page 122 of the 2016 Blackberry annual report below. You can navigate through the pages in the report by either clicking on the pages listed below, or by using the keyword search tool below to find specific information within the annual report.-
 1
1 -
2
-
3
-
4
-
5
-
6
-
7
-
8
-
9
-
10
-
11
-
12
-
13
-
14
-
15
-
16
-
17
-
18
-
19
-
20
-
21
-
22
-
23
-
24
-
25
-
26
-
27
-
28
-
29
-
30
-
31
-
32
-
33
-
34
-
35
-
36
-
37
-
38
-
39
-
40
-
41
-
42
-
43
-
44
-
45
-
46
-
47
-
48
-
49
-
50
-
51
-
52
-
53
-
54
-
55
-
56
-
57
-
58
-
59
-
60
-
61
-
62
-
63
-
64
-
65
-
66
-
67
-
68
-
69
-
70
-
71
-
72
-
73
-
74
-
75
-
76
-
77
-
78
-
79
-
80
-
81
-
82
-
83
-
84
-
85
-
86
-
87
-
88
-
89
-
90
-
91
-
92
-
93
-
94
-
95
-
96
-
97
-
98
-
99
-
100
-
101
-
102
-
103
-
104
-
105
-
106
-
107
-
108
-
109
-
110
-
111
-
 112
112 -
 113
113 -
 114
114 -
 115
115 -
 116
116 -
 117
117 -
 118
118 -
 119
119 -
 120
120 -
 121
121 -
 122
122 -
 123
123 -
 124
124 -
 125
125 -
 126
126 -
 127
127 -
 128
128 -
 129
129 -
 130
130 -
 131
131 -
 132
132 -
133
-
134
-
135
-
136
-
137
-
138
 |
 |

BlackBerry Limited
Management’s Discussion and Analysis of Financial Condition and Results of Operations
14
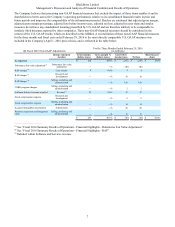
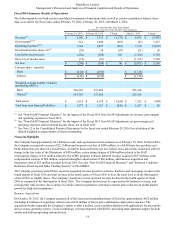
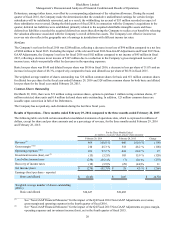
Fiscal 2016 Summary Results of Operations
The following table sets forth certain consolidated statements of operations data, as well as certain consolidated balance sheet
data, as at and for the fiscal years ended February 29, 2016, February 28, 2015, and March 1, 2014:
As at and for the Fiscal Years Ended
(in millions, except for share and per share amounts)
February 29, 2016 February 28, 2015 Change March 1, 2014 Change
Revenue(1) $ 2,160 $ 3,335 $ (1,175) $ 6,813 $ (3,478)
Gross margin(1)(2) 941 1,604 (663)(43) 1,647
Operating expenses(1)(2) 1,164 2,027 (863) 7,120 (5,093)
Investment income (loss), net (2) (59) 38 (97)(21) 59
Loss before income taxes (282) (385) 103 (7,184) 6,799
Recovery of income taxes (74) (81) 7 (1,311) 1,230
Net loss $ (208) $ (304) $ 96 $ (5,873) $ 5,569
Loss per share - reported
Basic $ (0.40) $ (0.58) $ (11.18)
Diluted $ (0.86) $ (0.58) $ (11.18)
Weighted-average number of shares
outstanding (000’s)
Basic 526,303 527,684 525,168
Diluted(3) 651,303 527,684 525,168
Total assets $ 5,534 $ 6,558 $ (1,024) $ 7,552 $ (994)
Total long-term financial liabilities $ 1,277 $ 1,707 $ (430) $ 1,627 $ 80
______________________________
(1) See “Non-GAAP Financial Measures” for the impact of the Fiscal 2016 Non-GAAP Adjustments on revenue, gross margin
and operating expenses in fiscal 2016.
(2) See “Non-GAAP Financial Measures” for the impact of the Fiscal 2015 Non-GAAP Adjustments on gross margin and
operating expenses and investment income (loss), net in fiscal 2015.
(3) See Note 12 to the Consolidated Financial Statements for the fiscal year ended February 29, 2016 for calculation of the
diluted weighted average number of shares outstanding.
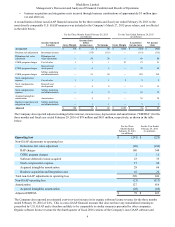
Financial Highlights
The Company had approximately $2.6 billion in cash, cash equivalents and investments as of February 29, 2016. In fiscal 2016,
the Company recognized revenues of $2.2 billion and incurred a net loss of $208 million, or a $0.40 basic loss per share and
$0.86 diluted loss per share on a GAAP basis. As further discussed below, net loss reflects non-cash income associated with the
change in the fair value of the Debentures of $430 million, restructuring charges of $344 million related to the RAP,
restructuring charges of $11 million related to the CORE program, software deferred revenue acquired of $33 million, stock
compensation expense of $60 million, acquired intangibles amortization of $66 million, and business acquisition and
integration costs of $22 million recorded in fiscal 2016. See also “Non-GAAP Financial Measures” and “Financial Condition -
Debenture Financing and Other Funding Sources” in this MD&A.
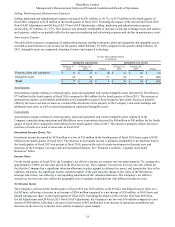
The Company previously stated that it expected sequential revenue growth in software, hardware and messaging revenue in the
fourth quarter of fiscal 2016 and total revenue in the fourth quarter of fiscal 2016 to be at the same level as in the third quarter
of fiscal 2016 or slightly above. The Company’s hardware revenue and total revenue declined in the fourth quarter of fiscal
2016 as compared to the third quarter of fiscal 2016. The Company did not meet its expectations for hardware revenue, and
consequently total revenue, due to delays in certain contract negotiations with major carriers and a reduction in global market
growth for high-end smartphones.
Business Acquisitions
On October 30, 2015, the Company acquired all of the issued and outstanding shares of Good for approximately $425 million
(including $2 million of acquisition related costs and $6 million of future post-combination employment expense). The
acquisition further expanded the Company’s ability to offer a unified, secure mobility platform with applications for any mobile
device on any operating system. Good’s technology is being integrated with BES12, providing multi-platform support for both
mobile and desktop operating system devices.