Blackberry 2016 Annual Report Download - page 130
Download and view the complete annual report
Please find page 130 of the 2016 Blackberry annual report below. You can navigate through the pages in the report by either clicking on the pages listed below, or by using the keyword search tool below to find specific information within the annual report.-
 1
1 -
2
-
3
-
4
-
5
-
6
-
7
-
8
-
9
-
10
-
11
-
12
-
13
-
14
-
15
-
16
-
17
-
18
-
19
-
20
-
21
-
22
-
23
-
24
-
25
-
26
-
27
-
28
-
29
-
30
-
31
-
32
-
33
-
34
-
35
-
36
-
37
-
38
-
39
-
40
-
41
-
42
-
43
-
44
-
45
-
46
-
47
-
48
-
49
-
50
-
51
-
52
-
53
-
54
-
55
-
56
-
57
-
58
-
59
-
60
-
61
-
62
-
63
-
64
-
65
-
66
-
67
-
68
-
69
-
70
-
71
-
72
-
73
-
74
-
75
-
76
-
77
-
78
-
79
-
80
-
81
-
82
-
83
-
84
-
85
-
86
-
87
-
88
-
89
-
90
-
91
-
92
-
93
-
94
-
95
-
96
-
97
-
98
-
99
-
100
-
101
-
102
-
103
-
104
-
105
-
106
-
107
-
108
-
109
-
110
-
111
-
112
-
113
-
114
-
115
-
116
-
117
-
118
-
119
-
 120
120 -
 121
121 -
 122
122 -
 123
123 -
 124
124 -
 125
125 -
 126
126 -
 127
127 -
 128
128 -
 129
129 -
 130
130 -
 131
131 -
 132
132 -
 133
133 -
 134
134 -
 135
135 -
 136
136 -
 137
137 -
 138
138
 |
 |

BlackBerry Limited
Management’s Discussion and Analysis of Financial Condition and Results of Operations
22
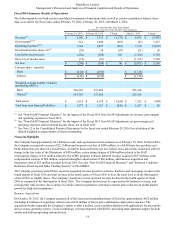
Service Access Fees Revenue
Service access fees revenue decreased by $158 million, or 52.5%, to $143 million, or 30.8% of revenue, in the fourth quarter of
fiscal 2016, compared to $301 million, or 45.6% of revenue, in the fourth quarter of fiscal 2015.
The decrease in service access fees revenue, which is generated from users of BlackBerry 7 and prior BlackBerry operating
systems, is primarily attributable to a lower number of those users and corresponding lower revenue from those users
(particularly as those users upgrade to BlackBerry devices that do not generate service access fees or to a competitor’s device),
compared to the fourth quarter of fiscal 2015, and a continued shift in the mix of the Company’s customers from higher-tiered
unlimited plans to prepaid and lower-tiered plans as well as pricing reduction programs implemented by the Company to
maintain the customer base.
In the third quarter of fiscal 2016, the Company stated its expectations that service access fees revenues would decline by
approximately 18% in the fourth quarter of fiscal 2016. Service access fees revenues for the fourth quarter of fiscal 2016
decreased by approximately 17% compared to the third quarter of fiscal 2016. The Company expects service access fees
revenue to continue to decline by 18% in the first quarter of fiscal 2017.
Other Revenue
Other revenue decreased by $4 million, or 36.4%, to $7 million in the fourth quarter of fiscal 2016 compared to $11 million in
the fourth quarter of fiscal 2015. The decrease was primarily attributable to decreases in non-warranty repair revenue, partially
offset by telecommunications revenue of AtHoc.
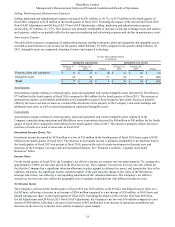
Gross Margin
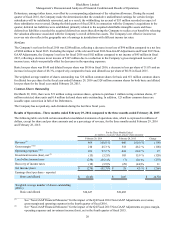
Gross margin decreased by $108 million, or 34.0%, to $210 million, or 45.3% of revenue, in the fourth quarter of fiscal 2016,
compared to $318 million, or 48.2% of revenue, in the fourth quarter of fiscal 2015. Excluding the relevant Q4 Fiscal 2016
Non-GAAP Adjustments and Q4 Fiscal 2015 Non-GAAP Adjustments, gross margin decreased by $83 million to $237 million,
or 48.7% of revenue, compared to $320 million, or 48.5% of revenue, in the fourth quarter of fiscal 2015.
The $83 million decrease in gross margin was primarily attributable to a decrease in the number of devices for which revenue
was recognized due to decreased hardware demand, as well as a reduction in service access fees revenue. The decrease was
partially offset by an increase in software and services revenue, as well as an increase in the average selling prices of certain
devices recognized, as previously described. Generally, service revenues earn higher gross margins than sales of handheld
devices and hardware revenues have lower gross margins than the Company’s overall gross margin.
In the third quarter of fiscal 2016, the Company stated that in the fourth quarter of fiscal 2016 it expected non-GAAP gross
margin of approximately 40% and expected gross margin on hardware to increase. The non-GAAP gross margin in the fourth
quarter of fiscal 2016 was 48.7% due to higher margins in hardware and software and services. The Company expects non-
GAAP gross margin in the first quarter of fiscal 2017 of approximately 45% to 50%.