Blackberry 2016 Annual Report Download - page 127
Download and view the complete annual report
Please find page 127 of the 2016 Blackberry annual report below. You can navigate through the pages in the report by either clicking on the pages listed below, or by using the keyword search tool below to find specific information within the annual report.-
 1
1 -
2
-
3
-
4
-
5
-
6
-
7
-
8
-
9
-
10
-
11
-
12
-
13
-
14
-
15
-
16
-
17
-
18
-
19
-
20
-
21
-
22
-
23
-
24
-
25
-
26
-
27
-
28
-
29
-
30
-
31
-
32
-
33
-
34
-
35
-
36
-
37
-
38
-
39
-
40
-
41
-
42
-
43
-
44
-
45
-
46
-
47
-
48
-
49
-
50
-
51
-
52
-
53
-
54
-
55
-
56
-
57
-
58
-
59
-
60
-
61
-
62
-
63
-
64
-
65
-
66
-
67
-
68
-
69
-
70
-
71
-
72
-
73
-
74
-
75
-
76
-
77
-
78
-
79
-
80
-
81
-
82
-
83
-
84
-
85
-
86
-
87
-
88
-
89
-
90
-
91
-
92
-
93
-
94
-
95
-
96
-
97
-
98
-
99
-
100
-
101
-
102
-
103
-
104
-
105
-
106
-
107
-
108
-
109
-
110
-
111
-
112
-
113
-
114
-
115
-
116
-
 117
117 -
 118
118 -
 119
119 -
 120
120 -
 121
121 -
 122
122 -
 123
123 -
 124
124 -
 125
125 -
 126
126 -
 127
127 -
 128
128 -
 129
129 -
 130
130 -
 131
131 -
 132
132 -
 133
133 -
 134
134 -
 135
135 -
 136
136 -
 137
137 -
138
 |
 |
BlackBerry Limited
Management’s Discussion and Analysis of Financial Condition and Results of Operations
19
Research and Development Expenses
Research and development expenses consist primarily of salaries and benefits for technical personnel, new product
development costs, travel, office and building infrastructure costs and other employee costs.
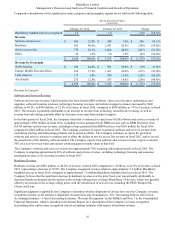
Research and development expenses decreased by $242 million, or 34.0%, to $469 million, or 21.7% of revenue, in fiscal 2016,
compared to $711 million, or 21.3%, in fiscal 2015. Excluding the impact of the relevant Fiscal 2016 Non-GAAP Adjustments
and Fiscal 2015 Non-GAAP Adjustments, research and development expenses decreased by $223 million, or 35.6%. The
decrease was primarily attributable to reduced salaries and benefits as a result of a reduction in headcount and reductions in
facilities and maintenance costs compared to fiscal 2015.
Selling, Marketing and Administration Expenses
Selling, marketing and administration expenses consist primarily of marketing, advertising and promotion, salaries and
benefits, external advisory fees, information technology costs, office and related staffing infrastructure costs and travel
expenses.
Selling, marketing and administration expenses decreased by $192 million, or 21.2%, to $712 million, or 33.0% of revenue, in
fiscal 2016 compared to $904 million in fiscal 2015, or 27.1% of revenue. Excluding the impact of the relevant Fiscal 2016
Non-GAAP Adjustments and Fiscal 2015 Non-GAAP Adjustments, selling, marketing and administration expenses decreased
by $152 million, or 22.6%. The decrease was primarily attributable to reductions in marketing and advertising costs and
salaries and benefits as a result of reductions in headcount, partially offset by increases in foreign exchange losses compared to
fiscal 2015.
Amortization Expense
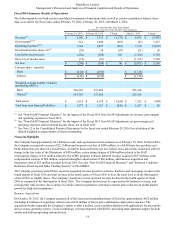
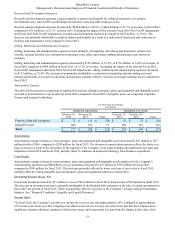
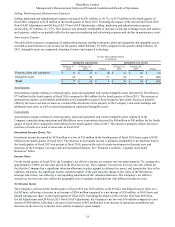
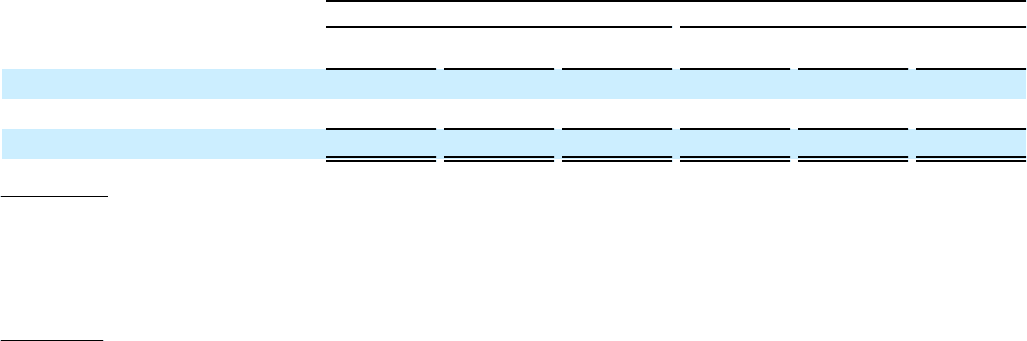
The table below presents a comparison of amortization expense relating to property, plant and equipment and intangible assets
recorded as amortization or cost of sales for fiscal 2016 compared to fiscal 2015. Intangible assets are comprised of patents,
licenses and acquired technology.
For the Fiscal Years Ended
(in millions)
Included in Amortization Included in Cost of sales
February 29,
2016 February 28,
2015 Change February 29,
2016 February 28,
2015 Change
Property, plant and equipment $ 73 $ 111 $ (38) $ 51 $ 73 $ (22)
Intangible assets 204 187 17 288 323 (35)
Total $ 277 $ 298 $ (21) $ 339 $ 396 $ (57)
Amortization
Amortization expense relating to certain property, plant and equipment and intangible assets decreased by $21 million to $277
million for fiscal 2016, compared to $298 million for fiscal 2015. The decrease in amortization expense reflects the lower cost
base of assets as a result of the divestiture of the majority of the Company’s real estate holdings and additional asset sales and
disposals in fiscal 2016 and fiscal 2015, partially offset by additions in acquired technology from business acquisitions.
Cost of sales
Amortization expense relating to certain property, plant and equipment and intangible assets employed in the Company’s
manufacturing operations and BlackBerry service operations decreased by $57 million to $339 million for fiscal 2016,
compared to $396 million for fiscal 2015. This decrease primarily reflects the lower cost base of asset sales in fiscal 2015,
partially offset by certain intangible asset and property, plant and equipment additions in fiscal 2016.
Investment Income (Loss), Net
Investment income decreased by $97 million to a loss of $59 million in fiscal 2016, from income of $38 million in fiscal 2015.
The decrease in investment income is primarily attributable to the Rockstar Sale and gains on the sale of certain investments in
fiscal 2015 not present in fiscal 2016, which was partially offset by increases in the Company’s average cash and investment
balances. See “Financial Condition - Liquidity and Capital Resources”.
Income Taxes
For fiscal 2016, the Company’s net effective income tax recovery rate was approximately 26%, compared to approximately
21% for the prior fiscal year. The Company's net effective income tax recovery rate reflects the fact that the Company has a
significant valuation allowance against its deferred tax assets, and in particular, the gain from the change in fair value of the