Blackberry 2016 Annual Report Download - page 101
Download and view the complete annual report
Please find page 101 of the 2016 Blackberry annual report below. You can navigate through the pages in the report by either clicking on the pages listed below, or by using the keyword search tool below to find specific information within the annual report.-
 1
1 -
2
-
3
-
4
-
5
-
6
-
7
-
8
-
9
-
10
-
11
-
12
-
13
-
14
-
15
-
16
-
17
-
18
-
19
-
20
-
21
-
22
-
23
-
24
-
25
-
26
-
27
-
28
-
29
-
30
-
31
-
32
-
33
-
34
-
35
-
36
-
37
-
38
-
39
-
40
-
41
-
42
-
43
-
44
-
45
-
46
-
47
-
48
-
49
-
50
-
51
-
52
-
53
-
54
-
55
-
56
-
57
-
58
-
59
-
60
-
61
-
62
-
63
-
64
-
65
-
66
-
67
-
68
-
69
-
70
-
71
-
72
-
73
-
74
-
75
-
76
-
77
-
78
-
79
-
80
-
81
-
82
-
83
-
84
-
85
-
86
-
87
-
88
-
89
-
90
-
 91
91 -
 92
92 -
 93
93 -
 94
94 -
 95
95 -
 96
96 -
 97
97 -
 98
98 -
 99
99 -
 100
100 -
 101
101 -
 102
102 -
 103
103 -
 104
104 -
 105
105 -
 106
106 -
 107
107 -
 108
108 -
 109
109 -
 110
110 -
 111
111 -
112
-
113
-
114
-
115
-
116
-
117
-
118
-
119
-
120
-
121
-
122
-
123
-
124
-
125
-
126
-
127
-
128
-
129
-
130
-
131
-
132
-
133
-
134
-
135
-
136
-
137
-
138
 |
 |

BlackBerry Limited
Notes to the Consolidated Financial Statements
In millions of United States dollars, except share and per share data, and except as otherwise indicated
33
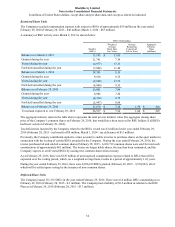
money options) that would have been received by the option holders if all in-the-money options had been exercised on
February 29, 2016. The intrinsic value of stock options exercised during fiscal 2016, calculated using the average market
price during the year, was approximately $2.16 per share.
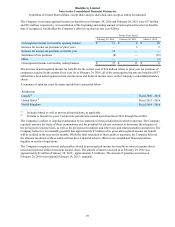
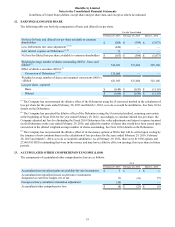
A summary of unvested stock options since February 28, 2015 is shown below:
Options Outstanding
Number
(000’s)
Weighted Average
Grant Date Fair
Value
Balance as at February 28, 2015 920 $ 4.27
Granted during the year 772 2.49
Vested during the year (461) 4.23
Forfeited during the year (251) 4.01
Balance as at February 29, 2016 980 $ 2.95
As at February 29, 2016, there was $3 million of unrecognized stock-based compensation expense related to unvested
stock options which will be expensed over the vesting period, which, on a weighted average basis, results in a period of
approximately 1.60 years. The total fair value of stock options vested during the year ended February 29, 2016 amounted
to $2 million (February 28, 2015 - $3 million, March 1, 2014 - $8 million).
Cash received from the stock options exercised for the year ended February 29, 2016 amounted to $3 million
(February 28, 2015 - $6 million; March 1, 2014 - $3 million). There were no tax deficiencies incurred by the Company
related to stock options exercised at February 29, 2016 (February 28, 2015 – tax deficiency of nil; March 1, 2014 – tax
deficiency of $2 million).
During the year ended February 29, 2016, there were 772,056 stock options granted (February 28, 2015 - 526,091;
March 1, 2014 - nil). The weighted average fair value of these grants was calculated using the BSM option pricing model
with the following assumptions:
February 29,
2016 February 28,
2015
Weighted average grant date fair value of stock options granted during the period $ 2.49 $ 4.32
Assumptions:
Risk-free interest rates 1.00% 1.25%
Expected life in years 3.38 3.67
Expected dividend yield —% —%
Volatility 54.60% 56.59%
The Company has no current expectation of paying cash dividends on its common shares. The risk-free interest rates
utilized during the life of the stock options are based on a U.S. Treasury security for an equivalent period. The Company
estimates the volatility of its common shares at the date of grant based on a combination of the implied volatility of
publicly traded options on its common shares and historical volatility, as the Company believes that this is a reasonable
indicator of expected volatility going forward. The expected life of stock options granted under the Equity Plan is based
on historical exercise patterns, which the Company believes are representative of future exercise patterns.