Blackberry 2016 Annual Report Download - page 68
Download and view the complete annual report
Please find page 68 of the 2016 Blackberry annual report below. You can navigate through the pages in the report by either clicking on the pages listed below, or by using the keyword search tool below to find specific information within the annual report.-
 1
1 -
2
-
3
-
4
-
5
-
6
-
7
-
8
-
9
-
10
-
11
-
12
-
13
-
14
-
15
-
16
-
17
-
18
-
19
-
20
-
21
-
22
-
23
-
24
-
25
-
26
-
27
-
28
-
29
-
30
-
31
-
32
-
33
-
34
-
35
-
36
-
37
-
38
-
39
-
40
-
41
-
42
-
43
-
44
-
45
-
46
-
47
-
48
-
49
-
50
-
51
-
52
-
53
-
54
-
55
-
56
-
57
-
 58
58 -
 59
59 -
 60
60 -
 61
61 -
 62
62 -
 63
63 -
 64
64 -
 65
65 -
 66
66 -
 67
67 -
 68
68 -
 69
69 -
 70
70 -
 71
71 -
 72
72 -
 73
73 -
 74
74 -
 75
75 -
 76
76 -
 77
77 -
 78
78 -
79
-
80
-
81
-
82
-
83
-
84
-
85
-
86
-
87
-
88
-
89
-
90
-
91
-
92
-
93
-
94
-
95
-
96
-
97
-
98
-
99
-
100
-
101
-
102
-
103
-
104
-
105
-
106
-
107
-
108
-
109
-
110
-
111
-
112
-
113
-
114
-
115
-
116
-
117
-
118
-
119
-
120
-
121
-
122
-
123
-
124
-
125
-
126
-
127
-
128
-
129
-
130
-
131
-
132
-
133
-
134
-
135
-
136
-
137
-
138
 |
 |

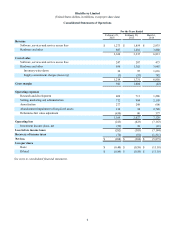
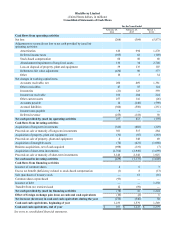
BlackBerry Limited
(United States dollars, in millions)
Consolidated Statements of Cash Flows
For the Years Ended
February 29,
2016 February 28,
2015 March 1,
2014
Cash flows from operating activities
Net loss (208)(304)(5,873)
Adjustments to reconcile net loss to net cash provided by (used in)
operating activities:
Amortization 616 694 1,270
Deferred income taxes (105) 62 (149)
Stock-based compensation 60 50 68
Abandonment/impairment of long-lived assets 136 34 2,748
Loss on disposal of property, plant and equipment 59 135 107
Debentures fair value adjustment (430) 80 377
Other 16 3 34
Net changes in working capital items
Accounts receivable, net 200 469 1,381
Other receivables 47 55 124
Inventories (21) 123 359
Income tax receivable 166 204 224
Other current assets 257 116 (26)
Accounts payable 14 (240)(590)
Accrued liabilities (304)(550)(251)
Income taxes payable 9 — —
Deferred revenue (255)(118) 38
Net cash provided by (used in) operating activities 257 813 (159)
Cash flows from investing activities
Acquisition of long-term investments (326)(802)(229)
Proceeds on sale or maturity of long-term investments 301 515 284
Acquisition of property, plant and equipment (32)(87)(283)
Proceeds on sale of property, plant and equipment 4 348 49
Acquisition of intangible assets (70)(421)(1,080)
Business acquisitions, net of cash acquired (698)(119)(7)
Acquisition of short-term investments (2,764)(2,949)(1,699)
Proceeds on sale or maturity of short-term investments 3,146 2,342 1,925
Net cash used in investing activities (439)(1,173)(1,040)
Cash flows from financing activities
Issuance of common shares 4 6 3
Excess tax benefit (deficiency) related to stock-based compensation (1) 8 (13)
Sale (purchase) of treasury stock — 61 (16)
Common shares repurchased (93) — —
Issuance of debt — — 1,250
Transfer from (to) restricted cash 12 (59) —
Net cash provided by (used in) financing activities (78) 16 1,224
Effect of foreign exchange gain (loss) on cash and cash equivalents (16)(2) 5
Net increase (decrease) in cash and cash equivalents during the year (276)(346) 30
Cash and cash equivalents, beginning of year 1,233 1,579 1,549
Cash and cash equivalents, end of year $ 957 $ 1,233 $ 1,579
See notes to consolidated financial statements.