BP 2005 Annual Report Download - page 94
Download and view the complete annual report
Please find page 94 of the 2005 BP annual report below. You can navigate through the pages in the report by either clicking on the pages listed below, or by using the keyword search tool below to find specific information within the annual report.-
 1
1 -
2
-
3
-
4
-
5
-
6
-
7
-
8
-
9
-
10
-
11
-
12
-
13
-
14
-
15
-
16
-
17
-
18
-
19
-
20
-
21
-
22
-
23
-
24
-
25
-
26
-
27
-
28
-
29
-
30
-
31
-
32
-
33
-
34
-
35
-
36
-
37
-
38
-
39
-
40
-
41
-
42
-
43
-
44
-
45
-
46
-
47
-
48
-
49
-
50
-
51
-
52
-
53
-
54
-
55
-
56
-
57
-
58
-
59
-
60
-
61
-
62
-
63
-
64
-
65
-
66
-
67
-
68
-
69
-
70
-
71
-
72
-
73
-
74
-
75
-
76
-
77
-
78
-
79
-
80
-
81
-
82
-
83
-
 84
84 -
 85
85 -
 86
86 -
 87
87 -
 88
88 -
 89
89 -
 90
90 -
 91
91 -
 92
92 -
 93
93 -
 94
94 -
 95
95 -
 96
96 -
 97
97 -
 98
98 -
 99
99 -
 100
100 -
 101
101 -
 102
102 -
 103
103 -
 104
104 -
105
-
106
-
107
-
108
-
109
-
110
-
111
-
112
-
113
-
114
-
115
-
116
-
117
-
118
-
119
-
120
-
121
-
122
-
123
-
124
-
125
-
126
-
127
-
128
-
129
-
130
-
131
-
132
-
133
-
134
-
135
-
136
-
137
-
138
-
139
-
140
-
141
-
142
-
143
-
144
-
145
-
146
-
147
-
148
-
149
-
150
-
151
-
152
-
153
-
154
-
155
-
156
-
157
-
158
-
159
-
160
-
161
-
162
-
163
-
164
-
165
-
166
-
167
-
168
-
169
-
170
-
171
-
172
-
173
-
174
-
175
-
176
-
177
-
178
-
179
-
180
 |
 |

92 Making energy more
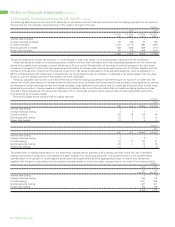
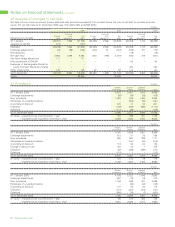
Notes on financial statements continued
42 Pensions and other post-retirement benefits continued
US post-
UK US retirement
pension pension benefit Other
HISTORY OF EXPERIENCE GAINS AND LOSSES plans plans plans plans Total
2005
Difference between the expected and actual return on plan assets
Amount ($ million) 3,111 96 – 157 3,364
Percentage of plan assets 13% 1% 0% 7% 10%
Actual return on plan assets
Amount ($ million) 4,567 653 2 280 5,502
Percentage of plan assets 20% 9% 7% 12% 17%
Experience gains and losses on plan liabilities
Amount ($ million) (14) (197) (17) 14 (214)
Percentage of the present value of plan liabilities 0% (2)% 0% 0% (1)%
Total amount recognized in statement of recognized income and expense
Amount ($ million) 1,213 (160) 219 (297) 975
Percentage of the present value of plan liabilities 6% (2)% 6% (4)% 3%
Cumulative amount recognized in statement of recognized income and expense
Amount ($ million) 2,162 (162) 373 (1,215) 1,158
Percentage of the present value of plan liabilities 11% (2)% 11% (16)% 3%
2004
Difference between the expected and actual return on plan assets
Amount ($ million) 818 379 – 152 1,349
Percentage of plan assets 4% 5% 0% 7% 4%
Actual return on plan assets
Amount ($ million) 2,169 905 2 256 3,332
Percentage of plan assets 10% 13% 7% 12% 11%
Experience gains and losses on plan liabilities
Amount ($ million) 83 (22) 33 (562) (468)
Percentage of the present value of plan liabilities 0% 0% 1% (7)% (1)%
Total amount recognized in statement of recognized income and expense
Amount ($ million) 106 249 528 (776) 107
Percentage of the present value of plan liabilities 1% 3% 14% (10)% 0%
Cumulative amount recognized in statement of recognized income and expense
Amount ($ million) 949 (2) 154 (918) 183
Percentage of the present value of plan liabilities 5% 0% 4% (11)% 0%
2003
Difference between the expected and actual return on plan assets
Amount ($ million) 1,639 749 2 2 2,392
Percentage of plan assets 9%11%6%0%9%
Actual return on plan assets
Amount ($ million) 2,692 1,100 4 96 3,892
Percentage of plan assets 14% 16% 12% 6% 14%
Experience gains and losses on plan liabilities
Amount ($ million) 641 30 67 135 873
Percentage of the present value of plan liabilities 4% 0% 2% 2% 2%
Total amount recognized in statement of recognized income and expense
Amount ($ million) 843 (251) (374) (142) 76
Percentage of the present value of plan liabilities 5% (3)% (9)% (2)% 0%
Cumulative amount recognized in statement of recognized income and expense
Amount ($ million) 843 (251) (374) (142) 76
Percentage of the present value of plan liabilities 5% (3)% (9)% (2)% 0%