BP 2005 Annual Report Download - page 82
Download and view the complete annual report
Please find page 82 of the 2005 BP annual report below. You can navigate through the pages in the report by either clicking on the pages listed below, or by using the keyword search tool below to find specific information within the annual report.-
 1
1 -
2
-
3
-
4
-
5
-
6
-
7
-
8
-
9
-
10
-
11
-
12
-
13
-
14
-
15
-
16
-
17
-
18
-
19
-
20
-
21
-
22
-
23
-
24
-
25
-
26
-
27
-
28
-
29
-
30
-
31
-
32
-
33
-
34
-
35
-
36
-
37
-
38
-
39
-
40
-
41
-
42
-
43
-
44
-
45
-
46
-
47
-
48
-
49
-
50
-
51
-
52
-
53
-
54
-
55
-
56
-
57
-
58
-
59
-
60
-
61
-
62
-
63
-
64
-
65
-
66
-
67
-
68
-
69
-
70
-
71
-
 72
72 -
 73
73 -
 74
74 -
 75
75 -
 76
76 -
 77
77 -
 78
78 -
 79
79 -
 80
80 -
 81
81 -
 82
82 -
 83
83 -
 84
84 -
 85
85 -
 86
86 -
 87
87 -
 88
88 -
 89
89 -
 90
90 -
 91
91 -
 92
92 -
93
-
94
-
95
-
96
-
97
-
98
-
99
-
100
-
101
-
102
-
103
-
104
-
105
-
106
-
107
-
108
-
109
-
110
-
111
-
112
-
113
-
114
-
115
-
116
-
117
-
118
-
119
-
120
-
121
-
122
-
123
-
124
-
125
-
126
-
127
-
128
-
129
-
130
-
131
-
132
-
133
-
134
-
135
-
136
-
137
-
138
-
139
-
140
-
141
-
142
-
143
-
144
-
145
-
146
-
147
-
148
-
149
-
150
-
151
-
152
-
153
-
154
-
155
-
156
-
157
-
158
-
159
-
160
-
161
-
162
-
163
-
164
-
165
-
166
-
167
-
168
-
169
-
170
-
171
-
172
-
173
-
174
-
175
-
176
-
177
-
178
-
179
-
180
 |
 |

80 Making energy more
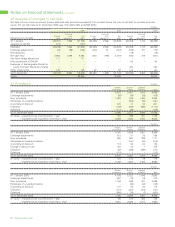
Notes on financial statements continued
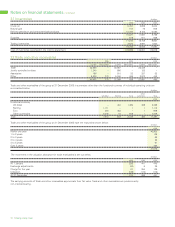
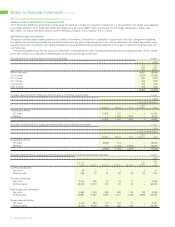
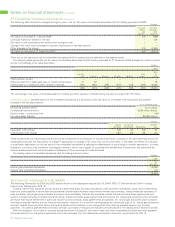
36 Financial instruments (UK GAAP) continued
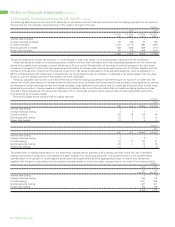
Interest rate swaps and futures are used by the group to modify the interest characteristics of its long-term finance debt from a fixed to a floating
rate basis or vice versa. The following table indicates the types of instruments used and their weighted average interest rates as at 31 December.
$ million except percentages
2004 2003
Receive fixed rate swaps – notional amount 8,182 7,432
Average receive fixed rate 3.1% 3.1%
Average pay floating rate 2.3% 1.1%
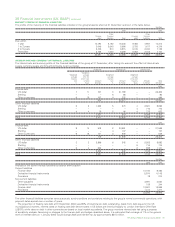
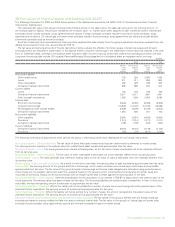
CURRENCY EXCHANGE RATE RISK
The monetary assets and monetary liabilities of the group in currencies other than the functional currency of individual operating units are
summarized below. These currency exposures arise from normal trading activities.
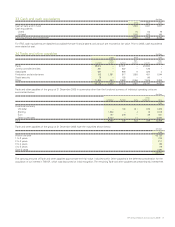
$ million
Net foreign currency monetary assets (liabilities)
Other
Functional currency US dollar Sterling Euro currencies Total
2004
US dollar – 374 2 (942) (566)
Sterling 314 – 380 66 760
Other currencies (269) (51) (25) (237) (582)
To t al 45 323 357 (1,113) (388)
2003
US dollar – 191 (24) 39 206
Sterling 67 – 308 34 409
Other currencies (1,148) (25) (27) (131) (1,331)
To t al (1,081) 166 257 (58) (716)
In accordance with its policy for managing foreign exchange rate risk, the group enters into various types of foreign exchange contracts, such as
currency swaps, forwards and options. The fair values and carrying amounts of these derivatives are shown in the fair value table in Note 38.
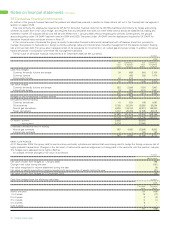
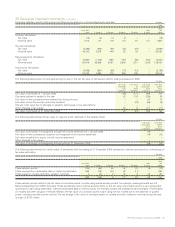
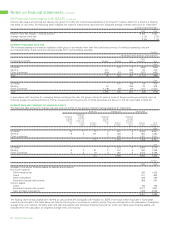
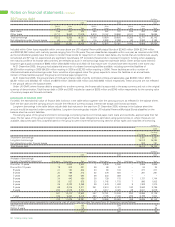
INTEREST RATE AND CURRENCY OF FINANCIAL ASSETS
The following table shows the interest rate and currency profile of the group’s material financial assets at 31 December.
Fixed rate Floating rate Interest free
Weighted
Weighted average Weighted Weighted
average time for average average
interest which rate interest time until
rate is fixed Amount rate Amount maturity Amount Total
% Years $ million % $ million Years $ million $ million
2004
US dollar 10 11 72 4 661 5 5,224 5,957
Sterling 8 2 101 3 428 5 864 1,393
Other currencies – – – 3 830 5 1,221 2,051
173 1,919 7,309 9,401
2003
US dollar – – – 3 1,015 4 2,060 3,075
Sterling 8 2 91 3 947 5 560 1,598
Other currencies 3 2 19 4 697 5 2,073 2,789
110 2,659 4,693 7,462
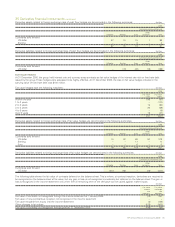
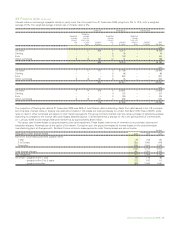
$ million
2004 2003
Analysis of the above financial assets by balance sheet caption
Non-current assets
Other investments 394 1,452
Loans 811 852
Other receivables 429 495
Derivative financial instruments 898 534
Current assets
Loans 193 182
Derivative financial instruments 5,317 1,891
Cash and cash equivalents 1,359 2,056
9,401 7,462
The floating rate financial assets earn interest at various rates set principally with respect to LIBOR or the local market equivalent. Fixed asset
investments included in the table above are held for the long term and have no maturity period. They are excluded from the calculation of weighted
average time until maturity. Similarly, cash and cash equivalents and derivative financial instruments, which are highly liquid financial assets, are
excluded from the calculation of weighted average time until maturity.