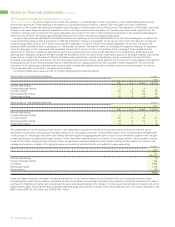
BP 2005 Annual Report Download - page 88
Download and view the complete annual report
Please find page 88 of the 2005 BP annual report below. You can navigate through the pages in the report by either clicking on the pages listed below, or by using the keyword search tool below to find specific information within the annual report.-
 1
1 -
2
-
3
-
4
-
5
-
6
-
7
-
8
-
9
-
10
-
11
-
12
-
13
-
14
-
15
-
16
-
17
-
18
-
19
-
20
-
21
-
22
-
23
-
24
-
25
-
26
-
27
-
28
-
29
-
30
-
31
-
32
-
33
-
34
-
35
-
36
-
37
-
38
-
39
-
40
-
41
-
42
-
43
-
44
-
45
-
46
-
47
-
48
-
49
-
50
-
51
-
52
-
53
-
54
-
55
-
56
-
57
-
58
-
59
-
60
-
61
-
62
-
63
-
64
-
65
-
66
-
67
-
68
-
69
-
70
-
71
-
72
-
73
-
74
-
75
-
76
-
77
-
 78
78 -
 79
79 -
 80
80 -
 81
81 -
 82
82 -
 83
83 -
 84
84 -
 85
85 -
 86
86 -
 87
87 -
 88
88 -
 89
89 -
 90
90 -
 91
91 -
 92
92 -
 93
93 -
 94
94 -
 95
95 -
 96
96 -
 97
97 -
 98
98 -
99
-
100
-
101
-
102
-
103
-
104
-
105
-
106
-
107
-
108
-
109
-
110
-
111
-
112
-
113
-
114
-
115
-
116
-
117
-
118
-
119
-
120
-
121
-
122
-
123
-
124
-
125
-
126
-
127
-
128
-
129
-
130
-
131
-
132
-
133
-
134
-
135
-
136
-
137
-
138
-
139
-
140
-
141
-
142
-
143
-
144
-
145
-
146
-
147
-
148
-
149
-
150
-
151
-
152
-
153
-
154
-
155
-
156
-
157
-
158
-
159
-
160
-
161
-
162
-
163
-
164
-
165
-
166
-
167
-
168
-
169
-
170
-
171
-
172
-
173
-
174
-
175
-
176
-
177
-
178
-
179
-
180
 |
 |

86 Making energy more
Notes on financial statements continued
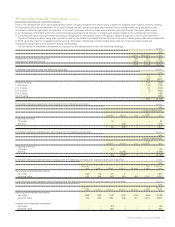
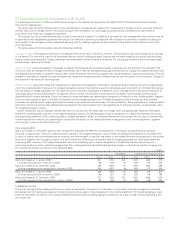
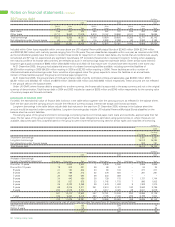
40 Analysis of changes in net debt
Net debt is current and non-current finance debt less cash and cash equivalents. The net debt ratio is the ratio of net debt to net debt plus total
equity. The net debt ratio at 31 December 2005 was 17% (2004 22% and 2003 22%).
$ million
2005 2004 2003
Cash and Cash and Cash and
Finance cash Net Finance cash Net Finance cash Net
Movement in net debt debt equivalents debt debt equivalents debt debt equivalents debt
At 1 January (23,091) 1,359 (21,732) (22,325) 2,056 (20,269) (22,008) 1,716 (20,292)
Adoption of IAS 39 (147) – (147) – – – – – –
Restated (23,238) 1,359 (21,879) (22,325) 2,056 (20,269) (22,008) 1,716 (20,292)
Exchange adjustments (44) (88) (132) (403) 91 (312) (199) 121 (78)
Debt acquired – – – – – – (15) – (15)
Net cash flow 3,803 1,689 5,492 (431) (788) (1,219) (760) 219 (541)
Fair value hedge adjustment 171 – 171 – – – – – –
Debt transferred to TNK-BP – – – – – – 93 – 93
Exchange of Exchangeable Bonds for –
Lukoil American Depositary Shares – – – – – – 420 – 420
Other movements 146 – 146 68 – 68 144 – 144
At 31 December (19,162) 2,960 (16,202) (23,091) 1,359 (21,732) (22,325) 2,056 (20,269)
Equity 80,765 78,235 70,264
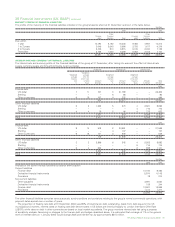
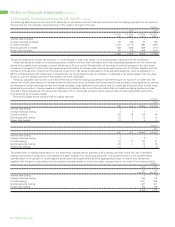
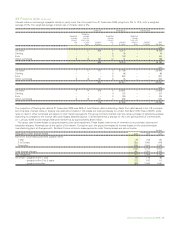
41 Provisions $ million
Decom- Environ- Litigation
missioning mental and other Total
At 1 January 2005 5,572 2,457 1,570 9,599
Exchange adjustments (38) (32) (35) (105)
New provisions 1,023 565 1,464 3,052
Write-back of unused provisions – (335) (86) (421)
Unwinding of discount 122 47 32 201
Utilization (128) (366) (650) (1,144)
Deletions (101) (25) – (126)
At 31 December 2005 6,450 2,311 2,295 11,056
Of which – expected to be incurred within 1 year 162 489 451 1,102
– expected to be incurred in more than 1 year 6,288 1,822 1,844 9,954
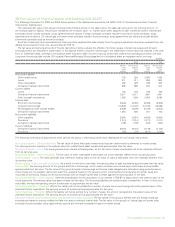
$ million
Decom- Environ- Litigation
missioning mental and other Total
At 1 January 2004 4,720 2,298 1,581 8,599
Exchange adjustments 213 21 25 259
New provisions 286 587 298 1,171
Write-back of unused provisions – (151) (64) (215)
Unwinding of discount 118 55 23 196
Change in discount rate 434 40 1 475
Utilization (87) (393) (294) (774)
Deletions (112) – – (112)
At 31 December 2004 5,572 2,457 1,570 9,599
Of which – expected to be incurred within 1 year 124 513 78 715
– expected to be incurred in more than 1 year 5,448 1,944 1,492 8,884
$ million
Decom- Environ- Litigation
missioning mental and other Total
At 1 January 2003 4,168 2,122 1,546 7,836
Exchange adjustments 257 28 28 313
New provisions 1,159 599 331 2,089
Write-back of unused provisions – (84) (64) (148)
Unwinding of discount 107 46 20 173
Utilization (121) (337) (273) (731)
Deletions (850) (76) (7) (933)
At 31 December 2003 4,720 2,298 1,581 8,599
Of which – expected to be incurred within 1 year 99 272 364 735
– expected to be incurred in more than 1 year 4,621 2,026 1,217 7,864