BP 2005 Annual Report Download - page 69
Download and view the complete annual report
Please find page 69 of the 2005 BP annual report below. You can navigate through the pages in the report by either clicking on the pages listed below, or by using the keyword search tool below to find specific information within the annual report.-
 1
1 -
2
-
3
-
4
-
5
-
6
-
7
-
8
-
9
-
10
-
11
-
12
-
13
-
14
-
15
-
16
-
17
-
18
-
19
-
20
-
21
-
22
-
23
-
24
-
25
-
26
-
27
-
28
-
29
-
30
-
31
-
32
-
33
-
34
-
35
-
36
-
37
-
38
-
39
-
40
-
41
-
42
-
43
-
44
-
45
-
46
-
47
-
48
-
49
-
50
-
51
-
52
-
53
-
54
-
55
-
56
-
57
-
58
-
 59
59 -
 60
60 -
 61
61 -
 62
62 -
 63
63 -
 64
64 -
 65
65 -
 66
66 -
 67
67 -
 68
68 -
 69
69 -
 70
70 -
 71
71 -
 72
72 -
 73
73 -
 74
74 -
 75
75 -
 76
76 -
 77
77 -
 78
78 -
 79
79 -
80
-
81
-
82
-
83
-
84
-
85
-
86
-
87
-
88
-
89
-
90
-
91
-
92
-
93
-
94
-
95
-
96
-
97
-
98
-
99
-
100
-
101
-
102
-
103
-
104
-
105
-
106
-
107
-
108
-
109
-
110
-
111
-
112
-
113
-
114
-
115
-
116
-
117
-
118
-
119
-
120
-
121
-
122
-
123
-
124
-
125
-
126
-
127
-
128
-
129
-
130
-
131
-
132
-
133
-
134
-
135
-
136
-
137
-
138
-
139
-
140
-
141
-
142
-
143
-
144
-
145
-
146
-
147
-
148
-
149
-
150
-
151
-
152
-
153
-
154
-
155
-
156
-
157
-
158
-
159
-
160
-
161
-
162
-
163
-
164
-
165
-
166
-
167
-
168
-
169
-
170
-
171
-
172
-
173
-
174
-
175
-
176
-
177
-
178
-
179
-
180
 |
 |

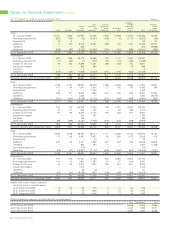
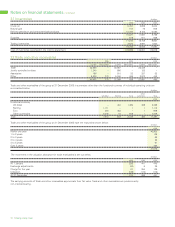
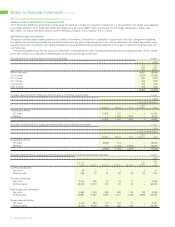
27 Goodwill $ million
2005 2004 2003
Cost
At 1 January 11,182 10,592 10,440
Exchange adjustments (488) 332 476
Acquisitions 86 328 5
Fair value adjustment – – (289)
Deletions (409) (70) (40)
At 31 December 10,371 11,182 10,592
Impairment losses
At 1 January 325 – –
Exchange adjustments – – –
Impairment in the year 59 325 –
Deletions (384) – –
At 31 December – 325 –
Net book amount at 31 December 10,371 10,857 10,592
28 Intangible assets $ million
2005 2004 2003
Exploration Other Exploration Other Exploration Other
expenditure intangibles Total expenditure intangibles Total expenditure intangibles Total
Cost
At 1 January 4,311 1,377 5,688 4,977 950 5,927 5,630 900 6,530
Exchange adjustments (66) (44) (110) 41 60 101 72 2 74
Acquisitions – – – – 15 15 – – –
Additions 950 531 1,481 754 352 1,106 579 136 715
Transfers (325) – (325) (1,036) – (1,036) (820) – (820)
Deletions (209) (124) (333) (425) – (425) (484) (88) (572)
At 31 December 4,661 1,740 6,401 4,311 1,377 5,688 4,977 950 5,927
Amortization
At 1 January 550 933 1,483 741 715 1,456 686 717 1,403
Exchange adjustments (8) (32) (40) 1 40 41 10 2 12
Charge for the year 305 161 466 274 178 452 297 77 374
Transfers (6) – (6) (196) – (196) (66) – (66)
Deletions (188) (86) (274) (270) – (270) (186) (81) (267)
At 31 December 653 976 1,629 550 933 1,483 741 715 1,456
Net book amount at 31 December 4,008 764 4,772 3,761 444 4,205 4,236 235 4,471
BP Annual Report and Accounts 2005 67