BP 2005 Annual Report Download - page 159
Download and view the complete annual report
Please find page 159 of the 2005 BP annual report below. You can navigate through the pages in the report by either clicking on the pages listed below, or by using the keyword search tool below to find specific information within the annual report.-
 1
1 -
2
-
3
-
4
-
5
-
6
-
7
-
8
-
9
-
10
-
11
-
12
-
13
-
14
-
15
-
16
-
17
-
18
-
19
-
20
-
21
-
22
-
23
-
24
-
25
-
26
-
27
-
28
-
29
-
30
-
31
-
32
-
33
-
34
-
35
-
36
-
37
-
38
-
39
-
40
-
41
-
42
-
43
-
44
-
45
-
46
-
47
-
48
-
49
-
50
-
51
-
52
-
53
-
54
-
55
-
56
-
57
-
58
-
59
-
60
-
61
-
62
-
63
-
64
-
65
-
66
-
67
-
68
-
69
-
70
-
71
-
72
-
73
-
74
-
75
-
76
-
77
-
78
-
79
-
80
-
81
-
82
-
83
-
84
-
85
-
86
-
87
-
88
-
89
-
90
-
91
-
92
-
93
-
94
-
95
-
96
-
97
-
98
-
99
-
100
-
101
-
102
-
103
-
104
-
105
-
106
-
107
-
108
-
109
-
110
-
111
-
112
-
113
-
114
-
115
-
116
-
117
-
118
-
119
-
120
-
121
-
122
-
123
-
124
-
125
-
126
-
127
-
128
-
129
-
130
-
131
-
132
-
133
-
134
-
135
-
136
-
137
-
138
-
139
-
140
-
141
-
142
-
143
-
144
-
145
-
146
-
147
-
148
-
 149
149 -
 150
150 -
 151
151 -
 152
152 -
 153
153 -
 154
154 -
 155
155 -
 156
156 -
 157
157 -
 158
158 -
 159
159 -
 160
160 -
 161
161 -
 162
162 -
 163
163 -
 164
164 -
 165
165 -
 166
166 -
 167
167 -
 168
168 -
 169
169 -
170
-
171
-
172
-
173
-
174
-
175
-
176
-
177
-
178
-
179
-
180
 |
 |

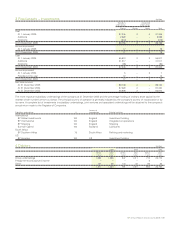
10 Share-based payments continued
The group used a Monte Carlo simulation to fair value the TSR element of the 2005 MTPP and EDIP plans. In accordance with the rules of the plans the
model simulates BP’s TSR and compares it against our principal strategic competitors over the three-year period of the plans. The model takes into
account the historic dividends, share price volatilities and covariances of BP and each comparator company to produce a predicted distribution of relative
share performance. This is applied to the reward criteria to give an expected value of the TSR element.
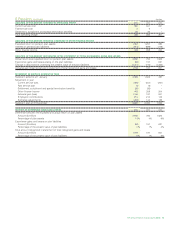
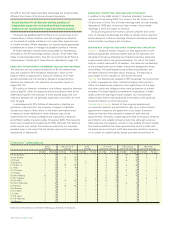
LTPP – LTPP – EDIP – EDIP –
Shares granted in 2004 SHRAM EPS/ROACE SHRAM EPS/ROACE RSP
Number of equity instruments granted (million) 6.8 4.1 0.9 0.5 0.1
Weighted average fair value $4.06 $7.21 $4.06 $7.21 $8.12
Fair value measurement basis Monte Carlo Market value Monte Carlo Market value Market value
LTPP – LTPP – EDIP – EDIP –
Shares granted in 2003 SHRAM EPS/ROACE SHRAM EPS/ROACE RSP
Number of equity instruments granted (million) 6.8 4.1 1.1 0.6 0.1
Weighted average fair value $3.53 $5.65 $3.53 $5.65 $6.43
Fair value measurement basis Monte Carlo Market value Monte Carlo Market value Market value
The group used a Monte Carlo simulation to fair value the SHRAM element of the 2003 and 2004 LTPP and EDIP plans. In accordance with the
rules of the plans, the model simulates BP’s SHRAM and compares it with the comparator companies (all companies in the FTSE World Oil and
Gas Index) and compares it to the comparator companies over the three-year period of the plans. The SHRAMs of the comparator companies have
been determined from market data over the preceding three-year period. The model takes into account the historic dividend yields, share price
volatilities and covariances of BP and each comparator company to produce a predicted distribution of relative share performance. This is applied
to the reward criteria to give an expected value of the SHRAM element.
Accounting expense does not necessarily represent the actual value of share-based payments made to recipients which are determined by the
Remuneration Committee according to established criteria.
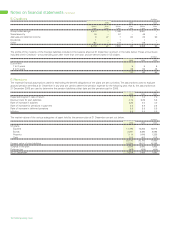
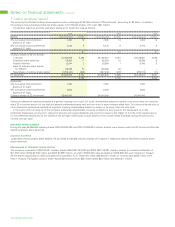
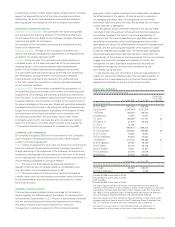
11 Directors’ remuneration $ million
2005 2004 2003
Total for all directors
Emoluments 18 19 17
Ex-gratia payments to executive directors retiring in the year – – 1
Gains made on the exercise of share options – 3 1
Amounts awarded under incentive schemes 8 6 4
Emoluments These amounts comprise fees paid to the non-executive chairman and the non-executive directors and, for executive directors, salary
and benefits earned during the relevant financial year, plus bonuses awarded for the year.
Pension contributions Five executive directors participated in a non-contributory pension scheme established for UK staff by a separate trust fund
to which contributions are made by BP based on actuarial advice. One US executive director participated in the US BP Retirement Accumulation
Plan during 2005.
Office facilities for former chairmen and deputy chairmen It is customary for the company to make available to former chairmen and deputy
chairmen, who were previously employed executives, the use of office and basic secretarial facilities following their retirement. The cost involved
in doing so is not significant.
Further information Full details of individual directors’ remuneration are given in the directors’ remuneration report on pages 164-173.
BP Annual Report and Accounts 2005 157