BP 2005 Annual Report Download - page 67
Download and view the complete annual report
Please find page 67 of the 2005 BP annual report below. You can navigate through the pages in the report by either clicking on the pages listed below, or by using the keyword search tool below to find specific information within the annual report.-
 1
1 -
2
-
3
-
4
-
5
-
6
-
7
-
8
-
9
-
10
-
11
-
12
-
13
-
14
-
15
-
16
-
17
-
18
-
19
-
20
-
21
-
22
-
23
-
24
-
25
-
26
-
27
-
28
-
29
-
30
-
31
-
32
-
33
-
34
-
35
-
36
-
37
-
38
-
39
-
40
-
41
-
42
-
43
-
44
-
45
-
46
-
47
-
48
-
49
-
50
-
51
-
52
-
53
-
54
-
55
-
56
-
 57
57 -
 58
58 -
 59
59 -
 60
60 -
 61
61 -
 62
62 -
 63
63 -
 64
64 -
 65
65 -
 66
66 -
 67
67 -
 68
68 -
 69
69 -
 70
70 -
 71
71 -
 72
72 -
 73
73 -
 74
74 -
 75
75 -
 76
76 -
 77
77 -
78
-
79
-
80
-
81
-
82
-
83
-
84
-
85
-
86
-
87
-
88
-
89
-
90
-
91
-
92
-
93
-
94
-
95
-
96
-
97
-
98
-
99
-
100
-
101
-
102
-
103
-
104
-
105
-
106
-
107
-
108
-
109
-
110
-
111
-
112
-
113
-
114
-
115
-
116
-
117
-
118
-
119
-
120
-
121
-
122
-
123
-
124
-
125
-
126
-
127
-
128
-
129
-
130
-
131
-
132
-
133
-
134
-
135
-
136
-
137
-
138
-
139
-
140
-
141
-
142
-
143
-
144
-
145
-
146
-
147
-
148
-
149
-
150
-
151
-
152
-
153
-
154
-
155
-
156
-
157
-
158
-
159
-
160
-
161
-
162
-
163
-
164
-
165
-
166
-
167
-
168
-
169
-
170
-
171
-
172
-
173
-
174
-
175
-
176
-
177
-
178
-
179
-
180
 |
 |

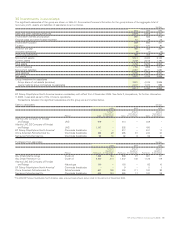
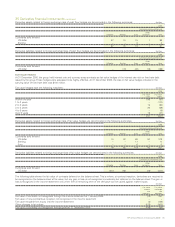
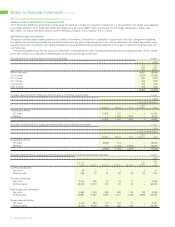
25 Group balance sheet analysis $ million
Capital expenditure Operating capital
and acquisitions employeda
By business 2005 2004 2003 2005 2004 2003
Exploration and Production
UK 821 762 786 6,265 9,144 9,070
Rest of Europe 197 255 279 1,451 1,558 1,476
USA 3,870 3,913 3,906 28,958 27,860 26,823
Rest of World 5,349 6,078 10,221 36,418 31,032 26,354
10,237 11,008 15,192 73,092 69,594 63,723
Refining and Marketing
UKb408 411 430 7,260 7,455 7,154
Rest of Europe 568 599 728 12,012 13,005 11,138
USA 1,226 1,314 1,480 19,342 17,452 15,977
Rest of World 570 495 381 7,011 6,766 6,129
2,772 2,819 3,019 45,625 44,678 40,398
Gas, Power and Renewables
UK 30 166 69 241 880 786
Rest of Europe 26 19 76 541 463 425
USA 96 80 158 2,576 1,694 1,659
Rest of World 83 259 136 1,737 1,836 1,405
235 524 439 5,095 4,873 4,275
Other businesses and corporate
UK 339 403 244 5,187 6,563 3,703
Rest of Europe 189 1,024 163 (4,268) (1,638) (2,046)
USA 277 698 423 (3,953) (2,306) 256
Rest of World 100 175 143 432 787 2,041
905 2,300 973 (2,602) 3,406 3,954
Consolidation adjustment (778) (552) (361)
14,149 16,651 19,623 120,432 121,999 111,989
By geographical area
UKb1,598 1,742 1,529 18,928 24,042 20,713
Rest of Europe 980 1,897 1,246 9,736 13,388 10,993
USA 5,469 6,005 5,967 46,192 44,148 44,354
Rest of World 6,102 7,007 10,881 45,576 40,421 35,929
14,149 16,651 19,623 120,432 121,999 111,989
Operating capital employed 120,432 121,999 111,989
Liabilities for current and deferred taxation (20,505) (20,673) (19,400)
Capital employed 99,927 101,326 92,589
Financed by
Finance debt 19,162 23,091 22,325
Minority interest 789 1,343 1,125
BP shareholders’ equity 79,976 76,892 69,139
99,927 101,326 92,589
aOperating capital employed is total assets less total liabilities, excluding finance debt and current and deferred taxation.
bUK area includes the UK-based international activities of Refining and Marketing.
BP Annual Report and Accounts 2005 65