BP 2005 Annual Report Download - page 130
Download and view the complete annual report
Please find page 130 of the 2005 BP annual report below. You can navigate through the pages in the report by either clicking on the pages listed below, or by using the keyword search tool below to find specific information within the annual report.-
 1
1 -
2
-
3
-
4
-
5
-
6
-
7
-
8
-
9
-
10
-
11
-
12
-
13
-
14
-
15
-
16
-
17
-
18
-
19
-
20
-
21
-
22
-
23
-
24
-
25
-
26
-
27
-
28
-
29
-
30
-
31
-
32
-
33
-
34
-
35
-
36
-
37
-
38
-
39
-
40
-
41
-
42
-
43
-
44
-
45
-
46
-
47
-
48
-
49
-
50
-
51
-
52
-
53
-
54
-
55
-
56
-
57
-
58
-
59
-
60
-
61
-
62
-
63
-
64
-
65
-
66
-
67
-
68
-
69
-
70
-
71
-
72
-
73
-
74
-
75
-
76
-
77
-
78
-
79
-
80
-
81
-
82
-
83
-
84
-
85
-
86
-
87
-
88
-
89
-
90
-
91
-
92
-
93
-
94
-
95
-
96
-
97
-
98
-
99
-
100
-
101
-
102
-
103
-
104
-
105
-
106
-
107
-
108
-
109
-
110
-
111
-
112
-
113
-
114
-
115
-
116
-
117
-
118
-
119
-
 120
120 -
 121
121 -
 122
122 -
 123
123 -
 124
124 -
 125
125 -
 126
126 -
 127
127 -
 128
128 -
 129
129 -
 130
130 -
 131
131 -
 132
132 -
 133
133 -
 134
134 -
 135
135 -
 136
136 -
 137
137 -
 138
138 -
 139
139 -
 140
140 -
141
-
142
-
143
-
144
-
145
-
146
-
147
-
148
-
149
-
150
-
151
-
152
-
153
-
154
-
155
-
156
-
157
-
158
-
159
-
160
-
161
-
162
-
163
-
164
-
165
-
166
-
167
-
168
-
169
-
170
-
171
-
172
-
173
-
174
-
175
-
176
-
177
-
178
-
179
-
180
 |
 |

128 Making energy more
Notes on financial statements continued
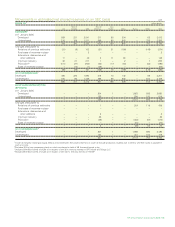
52 Oil and natural gas exploration and production activitiesa$ million
2005
Rest of Rest of Asia
UK Europe USA Americas Pacific Africa Russia Other Total
CAPITALIZED COSTS AT 31 DECEMBER
Gross capitalized costs
Proved properties 28,453 4,608 46,288 9,585 2,922 12,183 – 5,184 109,223
Unproved properties 276 135 1,547 583 1,124 656 185 155 4,661
28,729 4,743 47,835 10,168 4,046 12,839 185 5,339 113,884
Accumulated depreciation 19,203 2,949 22,016 4,919 1,508 6,112 – 1,200 57,907
Net capitalized costs 9,526 1,794 25,819 5,249 2,538 6,727 185 4,139 55,977
The group’s share of jointly controlled entities’ and associates’ net capitalized costs at 31 December 2005 was $10,670 million.
COSTS INCURRED FOR THE
YEAR ENDED 31 DECEMBER
Acquisition of properties
Proved – – –- – – – – – –
Unproved – – 29 34 – – – – 63
– – 29 34 – – – – 63
Exploration and appraisal costsb51 7 606 133 11 264 126 68 1,266
Development costs 790 188 2,965 681 186 1,691 – 1,177 7,678
Total costs 841 195 3,600 848 197 1,955 126 1,245 9,007
The group’s share of jointly controlled entities’ and associates’ costs incurred in 2005 was $1,205 million.
RESULTS OF OPERATIONS FOR THE
YEAR ENDED 31 DECEMBER
Sales and other operating revenuesc
Third parties 4,667 635 2,048 2,260 1,045 1,350 – 690 12,695
Sales between businesses 2,458 976 14,842 2,863 782 2,402 – 4,796 29,119
7,125 1,611 16,890 5,123 1,827 3,752 – 5,486 41,814
Exploration expenditure 32 1 426 84 6 81 37 17 684
Production costs 1,082 118 1,814 578 159 460 – 180 4,391
Production taxes 485 33 610 281 54 – – 1,536 2,999
Other costs (income)d1,857 (55) 2,200 537 170 98 8 2,042 6,857
Depreciation, depletion
and amortization 1,548 220 2,288 675 162 542 – 193 5,628
Impairment and (gains) losses on sale
of businesses and fixed assets 44 (1,038) 232 (133) – – 2 – (893)
5,048 (721) 7,570 2,022 551 1,181 47 3,968 19,666
Profit before taxatione2,077 2,332 9,320 3,101 1,276 2,571 (47) 1,518 22,148
Allocable taxes 405 880 3,377 1,390 447 1,043 (1) 409 7,950
Results of operations 1,672 1,452 5,943 1,711 829 1,528 (46) 1,109 14,198
The group’s share of jointly controlled entities’ and associates’ results of operations in 2005 was a profit of $3,035 million after deducting interest
of $226 million, taxation of $1,250 million and minority interest of $104 million.
aThis note relates to the requirements contained within the UK Statement of Recommended Practice ‘Accounting for Oil and Gas Exploration, Development, Production
and Decommissioning Activities’. Mid-stream activities of natural gas gathering and distribution and the operation of the main pipelines and tankers are excluded. The
main mid-stream activities are the Alaskan transportation facilities, the Forties Pipeline system and the Central Area Transmission System. The group’s share of jointly
controlled entities’ and associates’ activities is excluded from the tables and included in the footnotes, with the exception of the Abu Dhabi operations, which are
included in the income and expenditure items above.
bIncludes exploration and appraisal drilling expenditures, which are capitalized within intangible fixed assets, and geological and geophysical exploration costs, which are
charged to income as incurred.
cSales and other operating revenues represents proceeds from the sale of production and other crude oil and gas, including royalty oil sold on behalf of others where
royalty is payable in cash.
dIncludes the value of royalty oil sold on behalf of others where royalty is payable in cash, property taxes, other government take, the fair value loss on embedded
derivatives $1,688 million and a $265 million charge incurred on the cancellation of an intragroup gas supply contract. The UK region includes a $530 million charge
offset by corresponding gains primarily in the US, relating to the group’s self-insurance programme.
eThe Exploration and Production profit before interest and tax comprises:
$ million
2005
Exploration and production activities
Group (as above) 22,148
Jointly controlled entities and associates 3,035
Mid-stream activities 325
Total profit before interest and tax 25,508