BP 2005 Annual Report Download - page 140
Download and view the complete annual report
Please find page 140 of the 2005 BP annual report below. You can navigate through the pages in the report by either clicking on the pages listed below, or by using the keyword search tool below to find specific information within the annual report.-
 1
1 -
2
-
3
-
4
-
5
-
6
-
7
-
8
-
9
-
10
-
11
-
12
-
13
-
14
-
15
-
16
-
17
-
18
-
19
-
20
-
21
-
22
-
23
-
24
-
25
-
26
-
27
-
28
-
29
-
30
-
31
-
32
-
33
-
34
-
35
-
36
-
37
-
38
-
39
-
40
-
41
-
42
-
43
-
44
-
45
-
46
-
47
-
48
-
49
-
50
-
51
-
52
-
53
-
54
-
55
-
56
-
57
-
58
-
59
-
60
-
61
-
62
-
63
-
64
-
65
-
66
-
67
-
68
-
69
-
70
-
71
-
72
-
73
-
74
-
75
-
76
-
77
-
78
-
79
-
80
-
81
-
82
-
83
-
84
-
85
-
86
-
87
-
88
-
89
-
90
-
91
-
92
-
93
-
94
-
95
-
96
-
97
-
98
-
99
-
100
-
101
-
102
-
103
-
104
-
105
-
106
-
107
-
108
-
109
-
110
-
111
-
112
-
113
-
114
-
115
-
116
-
117
-
118
-
119
-
120
-
121
-
122
-
123
-
124
-
125
-
126
-
127
-
128
-
129
-
 130
130 -
 131
131 -
 132
132 -
 133
133 -
 134
134 -
 135
135 -
 136
136 -
 137
137 -
 138
138 -
 139
139 -
 140
140 -
 141
141 -
 142
142 -
 143
143 -
 144
144 -
 145
145 -
 146
146 -
 147
147 -
 148
148 -
 149
149 -
 150
150 -
151
-
152
-
153
-
154
-
155
-
156
-
157
-
158
-
159
-
160
-
161
-
162
-
163
-
164
-
165
-
166
-
167
-
168
-
169
-
170
-
171
-
172
-
173
-
174
-
175
-
176
-
177
-
178
-
179
-
180
 |
 |

138 Making energy more
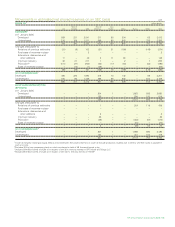
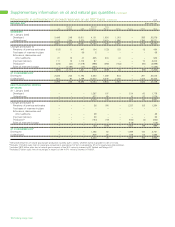
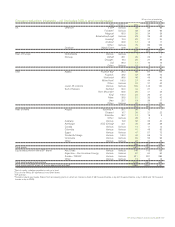
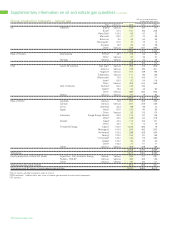
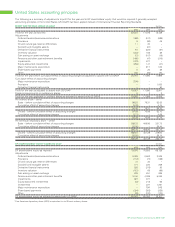
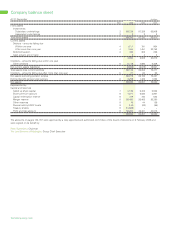
Supplementary information on oil and natural gas quantities continued
BP net share of production
Group production interests – natural gas million cubic feet a daya
Field Interest % 2005 2004 2003
UK Offshore BraesbVarious 165 147 174
Brucec37.0 161 163 222
West Solec100.0 55 67 73
Marnockc62.0 47 70 98
Britannia 9.0 46 54 55
Shearwater 27.5 37 76 70
Armada 18.2 30 50 58
Other Various 549 547 696
1,090 1,174 1,446
Rest of Europe Netherlands P/18-2c48.7 25 34 30
Other Various 37 46 37
Norway Various Various 46 45 52
108 125 119
USA Lower 48 onshore San JuancVarious 753 772 802
Arkoma Various 198 183 201
HugotoncVarious 151 158 182
Tuscaloosa Various 111 96 136
Wamsutterc70.5 110 105 111
Jonahc65.0 97 114 119
Other Various 465 514 558
Gulf of Mexico Na Kikac50.0 133 133 –
Marlinc78.2 52 43 93
Other Various 395 553 843
Alaska Various Various 81 78 83
2,546 2,749 3,128
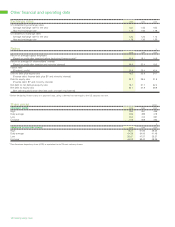
Rest of World Australia Various 15.8 367 308 285
Canada Various Various 307 349 422
China Yachengc34.3 98 99 74
Egypt Ha’pyc50.0 106 80 83
Other Various 83 115 170
Indonesia Sanga-Sanga (direct)c26.3 110 137 165
Otherc46.0 128 144 218
Sharjah Sajaac40.0 113 103 101
Other 40.0 10 14 19
Trinidad & Tobago Kapokc100.0 1,005 553 79
Mahoganyc100.0 303 453 503
Amherstiac100.0 289 408 624
Parangc100.0 154 137 152
Immortellec100.0 132 172 235
Cassiac100.0 83 85 30
Otherc100.0 21 111 71
Other Various Various 459 308 168
3,768 3,576 3,399
Total group 7,512 7,624 8,092
Equity-accounted entities (BP share) Argentina – Pan American Energy Various Various 343 317 281
Russia – TNK-BP Various Various 482 458 129
Other Various Various 87 104 111
Total equity-accounted entities 912 879 521
Total group and BP share of equity-accounted entities 8,424 8,503 8,613
aNet of royalty, whether payable in cash or in kind.
b2004 includes 11 million cubic feet a day of natural gas received as in-kind tariff payments.
cBP operator.