BP 2005 Annual Report Download - page 58
Download and view the complete annual report
Please find page 58 of the 2005 BP annual report below. You can navigate through the pages in the report by either clicking on the pages listed below, or by using the keyword search tool below to find specific information within the annual report.-
 1
1 -
2
-
3
-
4
-
5
-
6
-
7
-
8
-
9
-
10
-
11
-
12
-
13
-
14
-
15
-
16
-
17
-
18
-
19
-
20
-
21
-
22
-
23
-
24
-
25
-
26
-
27
-
28
-
29
-
30
-
31
-
32
-
33
-
34
-
35
-
36
-
37
-
38
-
39
-
40
-
41
-
42
-
43
-
44
-
45
-
46
-
47
-
 48
48 -
 49
49 -
 50
50 -
 51
51 -
 52
52 -
 53
53 -
 54
54 -
 55
55 -
 56
56 -
 57
57 -
 58
58 -
 59
59 -
 60
60 -
 61
61 -
 62
62 -
 63
63 -
 64
64 -
 65
65 -
 66
66 -
 67
67 -
 68
68 -
69
-
70
-
71
-
72
-
73
-
74
-
75
-
76
-
77
-
78
-
79
-
80
-
81
-
82
-
83
-
84
-
85
-
86
-
87
-
88
-
89
-
90
-
91
-
92
-
93
-
94
-
95
-
96
-
97
-
98
-
99
-
100
-
101
-
102
-
103
-
104
-
105
-
106
-
107
-
108
-
109
-
110
-
111
-
112
-
113
-
114
-
115
-
116
-
117
-
118
-
119
-
120
-
121
-
122
-
123
-
124
-
125
-
126
-
127
-
128
-
129
-
130
-
131
-
132
-
133
-
134
-
135
-
136
-
137
-
138
-
139
-
140
-
141
-
142
-
143
-
144
-
145
-
146
-
147
-
148
-
149
-
150
-
151
-
152
-
153
-
154
-
155
-
156
-
157
-
158
-
159
-
160
-
161
-
162
-
163
-
164
-
165
-
166
-
167
-
168
-
169
-
170
-
171
-
172
-
173
-
174
-
175
-
176
-
177
-
178
-
179
-
180
 |
 |

56 Making energy more
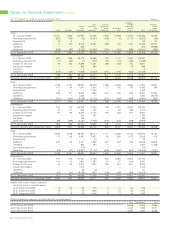
Notes on financial statements continued
12 Impairment and losses on sale of businesses and fixed assets $ million
2005 2004 2003
Impairment
Exploration and Production 266 404 1,013
Refining and Marketing 93 195 –
Other businesses and corporate 59 891 –
418 1,490 1,013
Loss on sale of businesses or termination of operations
Refining and Marketing – 279 28
Other businesses and corporate – 416 –
– 695 28
Loss on sale of fixed assets
Exploration and Production 39 227 403
Refining and Marketing 64 92 290
Gas, Power and Renewables – – 17
Other businesses and corporate 6 – 50
109 319 760
Loss on remeasurement to fair value less costs to sell and on disposal of Innovene operations 591 – –
1,118 2,504 1,801
Innovene operations (650) (1,114) –
Continuing operations 468 1,390 1,801
IMPAIRMENT
In assessing whether a write-down is required in the carrying value of a potentially impaired asset, its carrying value is compared with its recoverable
amount. The recoverable amount is the higher of the asset’s fair value less costs to sell and value in use. Given the nature of the group’s activities,
information on the fair value of an asset is usually difficult to obtain unless negotiations with potential purchasers are taking place. Consequently,
unless indicated otherwise, the recoverable amount used in assessing the impairment charges described below is value in use. The group generally
estimates value in use using a discounted cash flow model. The future cash flows are usually adjusted for risks specific to the asset and discounted
using a pre-tax discount rate of 10% (2004 9% and 2003 9%). This discount rate is derived from the group’s post-tax weighted average cost of
capital. A different pre-tax discount rate is used where the local tax rate is significantly different from the UK or US corporate tax rates.
Exploration and Production During 2005, Exploration and Production recognized total charges of $266 million for impairment in respect of producing oil and
gas properties. The major element of this was a charge of $226 million relating to fields in the Shelf and Coastal areas of the Gulf of Mexico. The triggers
for the impairment tests were primarily the effect of Hurricane Rita, which extensively damaged certain offshore and onshore production facilities, leading
to repair costs and higher estimates of the eventual cost of decommissioning the production facilities and, in addition, reduced estimates of the quantities
of hydrocarbons recoverable from some of these fields. The recoverable amount was based on management’s estimate of fair value less costs to sell
consistent with recent transactions in the area. The remainder related to fields in the UK North Sea, which were tested for impairment following a review
of the economic performance of these assets. During 2004, as a result of impairment triggers, reviews were conducted that have resulted in impairment
charges of $83 million in respect of King’s Peak in the Gulf of Mexico, $20 million in respect of two fields in the Gulf of Mexico Shelf Matagorda Island area
and $184 million in respect of various US onshore fields. A charge of $88 million was reflected in respect of a gas processing plant in the US and a charge
of $60 million following the blow-out of the Temsah platform in Egypt. In addition, following the lapse of the sale agreement for oil and gas properties in
Venezuela, $31 million of the previously booked impairment charge was released. The 2003 charge for impairment includes a charge of $296 million for
four fields in the Gulf of Mexico, following technical reassessment and re-evaluation of future investment options; charges of $133 million and $49 million
respectively for the Miller and Viscount fields in the UK North Sea as a result of a decision not to proceed with waterflood and gas import options and a
reserve write-down respectively; a charge of $105 million for the Yacheng field in China; a charge of $108 million for the Kepadong field in Indonesia; and
$47 million for the Eugene Island/West Cameron fields in the US as a result of reserve write-downs following completion of our routine full technical
reviews. In addition, there were impairment charges of $217 million and $58 million for oil and gas properties in Venezuela and Canada respectively, based
on fair value less costs to sell for transactions expected to complete in early 2004.
Refining and Marketing During 2005, certain retail assets were written down to fair value less costs to sell. With the formation of Olefins and
Derivatives at the end of 2004, certain agreements and assets were restructured to reflect the arm’s-length relationship that would exist in the
future. This has resulted in an impairment of the petrochemicals facilities at Hull, UK.
Other businesses and corporate The impairment charge for 2005 relates to the write-off of additional goodwill on the Solvay transactions. In 2004,
in connection with the Solvay transactions, the group recognized impairment charges of $325 million for goodwill and $270 million for property,
plant and equipment in BP Solvay Polyethylene Europe. As part of a restructuring of the North American Olefins and Derivatives businesses,
decisions were taken to exit certain businesses and facilities, resulting in impairments and write-downs of $294 million.
LOSS ON SALE OF BUSINESSES OR TERMINATION OF OPERATIONS
The principal transactions that give rise to these losses for each segment are described below.
Refining and Marketing In 2004, activities included the closure of two manufacturing plants at Hull, UK, which produced acids; the sale of the
European speciality intermediate chemicals business; and the closure of the lubricants operation of the Coryton refinery in the UK and of refining
operations at the ATAS refinery in Mersin, Turkey. For 2003, divestments included the sale of the group’s European oil speciality products business.
Other businesses and corporate For 2004, activities included the sale of the US speciality intermediate chemicals business; the sale of the fabrics
and fibres business; and the closure of the linear alpha-olefins production facility at Pasadena, Texas.
LOSS ON SALE OF FIXED ASSETS
The principal transactions that give rise to these losses for each segment are described below.
Exploration and Production The group divested interests in a number of oil and natural gas properties in all three years. For 2004, this included
interests in oil and natural gas properties in Indonesia and the Gulf of Mexico. In 2003, this included losses on exploration and production
properties in China, Norway and the US.
Refining and Marketing For 2004, the principal transactions contributing to the loss were divestment of the Singapore refinery and retail churn.
For 2003, loss arose from retail churn and the sale of refinery and retail interests in Germany and central Europe.