BP 2005 Annual Report Download - page 136
Download and view the complete annual report
Please find page 136 of the 2005 BP annual report below. You can navigate through the pages in the report by either clicking on the pages listed below, or by using the keyword search tool below to find specific information within the annual report.-
 1
1 -
2
-
3
-
4
-
5
-
6
-
7
-
8
-
9
-
10
-
11
-
12
-
13
-
14
-
15
-
16
-
17
-
18
-
19
-
20
-
21
-
22
-
23
-
24
-
25
-
26
-
27
-
28
-
29
-
30
-
31
-
32
-
33
-
34
-
35
-
36
-
37
-
38
-
39
-
40
-
41
-
42
-
43
-
44
-
45
-
46
-
47
-
48
-
49
-
50
-
51
-
52
-
53
-
54
-
55
-
56
-
57
-
58
-
59
-
60
-
61
-
62
-
63
-
64
-
65
-
66
-
67
-
68
-
69
-
70
-
71
-
72
-
73
-
74
-
75
-
76
-
77
-
78
-
79
-
80
-
81
-
82
-
83
-
84
-
85
-
86
-
87
-
88
-
89
-
90
-
91
-
92
-
93
-
94
-
95
-
96
-
97
-
98
-
99
-
100
-
101
-
102
-
103
-
104
-
105
-
106
-
107
-
108
-
109
-
110
-
111
-
112
-
113
-
114
-
115
-
116
-
117
-
118
-
119
-
120
-
121
-
122
-
123
-
124
-
125
-
 126
126 -
 127
127 -
 128
128 -
 129
129 -
 130
130 -
 131
131 -
 132
132 -
 133
133 -
 134
134 -
 135
135 -
 136
136 -
 137
137 -
 138
138 -
 139
139 -
 140
140 -
 141
141 -
 142
142 -
 143
143 -
 144
144 -
 145
145 -
 146
146 -
147
-
148
-
149
-
150
-
151
-
152
-
153
-
154
-
155
-
156
-
157
-
158
-
159
-
160
-
161
-
162
-
163
-
164
-
165
-
166
-
167
-
168
-
169
-
170
-
171
-
172
-
173
-
174
-
175
-
176
-
177
-
178
-
179
-
180
 |
 |

134 Making energy more
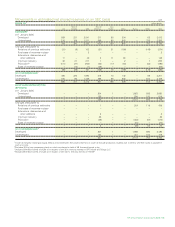
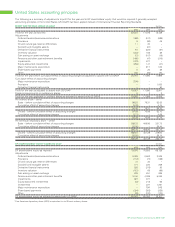
Supplementary information on oil and natural gas quantities continued
Movements in estimated net proved reserves on a UK SORP basis continued 2005
NATURAL GASabillion cubic feet
Rest of Rest of Asia
UK Europe USA Americas Pacific Africa Russia Other Total
SUBSIDIARY
At 1 January 2005
Developed 2,079 216 10,207 3,981 1,578 1,054 – 257 19,372
Undeveloped 923 1,183 2,553 10,824 5,278 1,677 – 1,112 23,550
3,002 1,399 12,760 14,805 6,856 2,731 – 1,369 42,922
Changes attributable to
Revisions of previous estimates (15) (12) (2) 122 140 301 – 125 659
Purchases of reserves-in-place – – 66 2 – – – – 68
Extensions, discoveries and
other additions 17 17 62 225 201 18 – – 540
Improved recovery 124 18 1,730 83 – – – 9 1,964
Production (395) (39) (1,006)b(870) (274) (154) – (77) (2,815)
Sales of reserves-in-place – (1,153) (16) (203) – – – – (1,372)
(269) (1,169) 834 (641) 67 165 – 57 (956)
AT 31 DECEMBER 2005c
Developed 1,962 184 9,916 3,433 1,423 987 – 242 18,147
Undeveloped 771 46 3,678 10,731 5,500 1,909 – 1,184 23,819
2,733 230 13,594 14,164 6,923 2,896 – 1,426 41,966
EQUITY-ACCOUNTED ENTITIES
(BP SHARE)
At 1 January 2005
Developed – – – 1,318 103 – 151 60 1,632
Undeveloped – – – 904 69 – – 23 996
– – – 2,222 172 – 151 83 2,628
Changes attributable to
Revisions of previous estimates – – – 21 (77) – 1,340 103 1,387
Purchases of reserves-in-place – – – – – – – – –
Extensions, discoveries and
other additions – – – 27 – – – – 27
Improved recovery – – – 53 – – – – 53
Production – – – (137) (17) – (176) (3) (333)
Sales of reserves-in-place – – – – – – (119) – (119)
– – – (36) (94) – 1,045 100 1,015
AT 31 DECEMBER 2005d
Developed – – – 1,403 50 – 1,019 131 2,603
Undeveloped – – – 783 28 – 177 52 1,040
– – – 2,186 78 – 1,196 183 3,643
TOTAL GROUP AND BP SHARE OF
EQUITY-ACCOUNTED ENTITIES 2,733 230 13,594 16,350 7,001 2,896 1,196 1,609 45,609
aNet proved reserves of natural gas exclude production royalties due to others, whether royalty is payable in cash or in kind.
bIncludes 64 billion cubic feet of natural gas consumed in operations.
cIncludes 3,872 billion cubic feet of natural gas in respect of the 30% minority interest in BP Trinidad and Tobago LLC.
dIncludes 54 billion cubic feet of natural gas in respect of the 4.47% minority interest in TNK-BP.