BP 2005 Annual Report Download - page 149
Download and view the complete annual report
Please find page 149 of the 2005 BP annual report below. You can navigate through the pages in the report by either clicking on the pages listed below, or by using the keyword search tool below to find specific information within the annual report.-
 1
1 -
2
-
3
-
4
-
5
-
6
-
7
-
8
-
9
-
10
-
11
-
12
-
13
-
14
-
15
-
16
-
17
-
18
-
19
-
20
-
21
-
22
-
23
-
24
-
25
-
26
-
27
-
28
-
29
-
30
-
31
-
32
-
33
-
34
-
35
-
36
-
37
-
38
-
39
-
40
-
41
-
42
-
43
-
44
-
45
-
46
-
47
-
48
-
49
-
50
-
51
-
52
-
53
-
54
-
55
-
56
-
57
-
58
-
59
-
60
-
61
-
62
-
63
-
64
-
65
-
66
-
67
-
68
-
69
-
70
-
71
-
72
-
73
-
74
-
75
-
76
-
77
-
78
-
79
-
80
-
81
-
82
-
83
-
84
-
85
-
86
-
87
-
88
-
89
-
90
-
91
-
92
-
93
-
94
-
95
-
96
-
97
-
98
-
99
-
100
-
101
-
102
-
103
-
104
-
105
-
106
-
107
-
108
-
109
-
110
-
111
-
112
-
113
-
114
-
115
-
116
-
117
-
118
-
119
-
120
-
121
-
122
-
123
-
124
-
125
-
126
-
127
-
128
-
129
-
130
-
131
-
132
-
133
-
134
-
135
-
136
-
137
-
138
-
 139
139 -
 140
140 -
 141
141 -
 142
142 -
 143
143 -
 144
144 -
 145
145 -
 146
146 -
 147
147 -
 148
148 -
 149
149 -
 150
150 -
 151
151 -
 152
152 -
 153
153 -
 154
154 -
 155
155 -
 156
156 -
 157
157 -
 158
158 -
 159
159 -
160
-
161
-
162
-
163
-
164
-
165
-
166
-
167
-
168
-
169
-
170
-
171
-
172
-
173
-
174
-
175
-
176
-
177
-
178
-
179
-
180
 |
 |

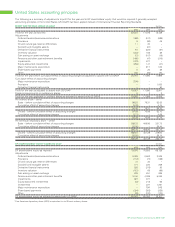
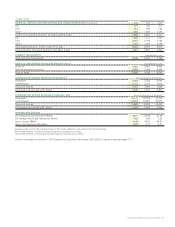
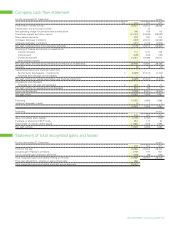
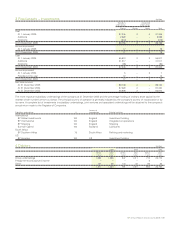
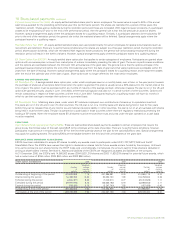
Company cash flow statement
For the year ended 31 December $ million
Note 2005 2004 2003
Profit before interest and tax 20,674 18,313 28,639
Depreciation and amounts provided – 12 –
Net operating charge for pensions less contributions 186 168 119
Dividends, interest and other income (21,197) (19,626) (28,622)
Share-based payments 278 224 210
(Increase) decrease in debtors (368) 22,374 (13,550)
Increase (decrease) in creditors (681) 2,448 (3,632)
Net cash (outflow) inflow from operating activities (1,108) 23,913 (16,836)
Servicing of finance and returns on investments
Interest received 110 1,137 708
Interest paid (249) (104) (130)
Dividends received 21,087 18,489 27,914
Other finance income – – –
Net cash inflow from servicing of finance and returns on investments 20,948 19,522 28,492
Tax paid (8) (3) (6)
Capital expenditure and financial investment
Payments for fixed assets – investments 3 (2,929) (31,517) (4,125)
Proceeds from the sale of fixed assets – – 2
Net cash outflow for capital expenditure and financial investment (2,929) (31,517) (4,123)
Acquisitions and disposals
Proceeds from the sale of businesses 3 519 85 17
Net cash outflow for acquisitions and disposals 519 85 17
Equity dividends paid (7,359) (6,041) (5,654)
Net cash inflow 10,063 5,959 1,890
Financing 10,064 5,958 1,889
Increase (decrease) in cash (1) 1 1
10,063 5,959 1,890
Financing $ million
2005 2004 2003
Issue of ordinary share capital (1,784) (1,737) (173)
Purchase of shares by ESOP trusts 251 147 63
Repurchase of ordinary share capital 11,597 7,548 1,999
Net cash outflow 10,064 5,958 1,889
Statement of total recognized gains and losses
For the year ended 31 December $ million
2005 2004 2003
Profit for the year 20,858 18,613 28,726
Actuarial gain relating to pensions 1,159 197 841
Tax on actuarial gain relating to pensions (348) (59) (252)
Total recognized gains and losses relating to the year 21,669 18,751 29,315
Prior year adjustment – change in accounting policy 362
Total recognized gains and losses since last annual accounts 22,031
BP Annual Report and Accounts 2005 147