BP 2005 Annual Report Download - page 152
Download and view the complete annual report
Please find page 152 of the 2005 BP annual report below. You can navigate through the pages in the report by either clicking on the pages listed below, or by using the keyword search tool below to find specific information within the annual report.-
 1
1 -
2
-
3
-
4
-
5
-
6
-
7
-
8
-
9
-
10
-
11
-
12
-
13
-
14
-
15
-
16
-
17
-
18
-
19
-
20
-
21
-
22
-
23
-
24
-
25
-
26
-
27
-
28
-
29
-
30
-
31
-
32
-
33
-
34
-
35
-
36
-
37
-
38
-
39
-
40
-
41
-
42
-
43
-
44
-
45
-
46
-
47
-
48
-
49
-
50
-
51
-
52
-
53
-
54
-
55
-
56
-
57
-
58
-
59
-
60
-
61
-
62
-
63
-
64
-
65
-
66
-
67
-
68
-
69
-
70
-
71
-
72
-
73
-
74
-
75
-
76
-
77
-
78
-
79
-
80
-
81
-
82
-
83
-
84
-
85
-
86
-
87
-
88
-
89
-
90
-
91
-
92
-
93
-
94
-
95
-
96
-
97
-
98
-
99
-
100
-
101
-
102
-
103
-
104
-
105
-
106
-
107
-
108
-
109
-
110
-
111
-
112
-
113
-
114
-
115
-
116
-
117
-
118
-
119
-
120
-
121
-
122
-
123
-
124
-
125
-
126
-
127
-
128
-
129
-
130
-
131
-
132
-
133
-
134
-
135
-
136
-
137
-
138
-
139
-
140
-
141
-
 142
142 -
 143
143 -
 144
144 -
 145
145 -
 146
146 -
 147
147 -
 148
148 -
 149
149 -
 150
150 -
 151
151 -
 152
152 -
 153
153 -
 154
154 -
 155
155 -
 156
156 -
 157
157 -
 158
158 -
 159
159 -
 160
160 -
 161
161 -
 162
162 -
163
-
164
-
165
-
166
-
167
-
168
-
169
-
170
-
171
-
172
-
173
-
174
-
175
-
176
-
177
-
178
-
179
-
180
 |
 |

150 Making energy more
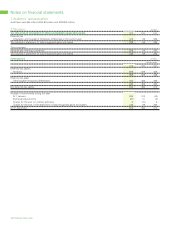
Notes on financial statements continued
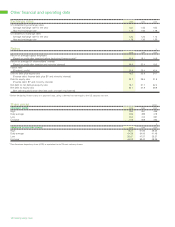
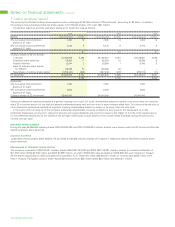
5 Creditors $ million
2005 2004 2003
Within After Within After Within After
1 year 1 year 1 year 1 year 1 year 1 year
Group undertakings 6,513 – 7,449 – 5,061 –
Social security 15 – 57 – 46 –
Accruals and deferred income 8 27 7 60 22 50
Dividends 1 – 1 – 1 –
Other 182 – 172 – 178 –
6,719 27 7,686 60 5,308 50
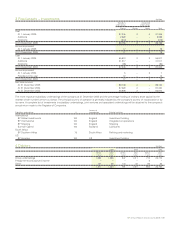
The profile of the maturity of the financial liabilities included in the balance sheet at 31 December is shown in the table below. These amounts are
included within Creditors – amounts falling due after more than one year, and are denominated in US dollars.
$ million
2005 2004 2003
Due within
1 to 2 years 5 5 5
2 to 5 years 22 55 45
27 60 50
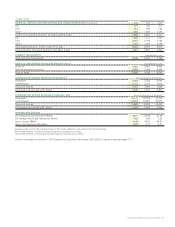
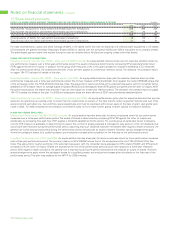
6 Pensions
The material financial assumptions used for estimating the benefit obligations of the plans are set out below. The assumptions used to evaluate
accrued pension benefits at 31 December in any year are used to determine pension expense for the following year, that is, the assumptions at
31 December 2005 are used to determine the pension liabilities at that date and the pension cost for 2006.
%
2005 2004 2003
Expected long-term rate of return 7.0 7.0 7.0
Discount rate for plan liabilities 4.75 5.25 5.5
Rate of increase in salaries 4.25 4.0 4.0
Rate of increase for pensions in payment 2.5 2.5 2.5
Rate of increase in deferred pensions 2.5 2.5 2.5
Inflation 2.5 2.5 2.5
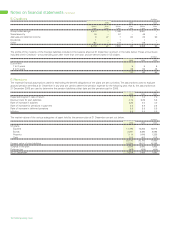
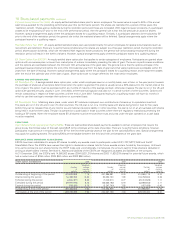
The market values of the various categories of asset held by the pension plan at 31 December are set out below.
$ million
2005 2004 2003
UK plans
Equities 17,796 16,263 13,815
Bonds 2,291 2,396 2,092
Property 1,114 1,645 1,325
Cash 919 402 618
22,120 20,706 17,850
Present value of plan liabilities 18,894 18,613 16,288
Surplus in the plan 3,226 2,093 1,562
Deferred tax (968) (628) (469)
At 31 December 2,258 1,465 1,093