BP 2005 Annual Report Download - page 72
Download and view the complete annual report
Please find page 72 of the 2005 BP annual report below. You can navigate through the pages in the report by either clicking on the pages listed below, or by using the keyword search tool below to find specific information within the annual report.-
 1
1 -
2
-
3
-
4
-
5
-
6
-
7
-
8
-
9
-
10
-
11
-
12
-
13
-
14
-
15
-
16
-
17
-
18
-
19
-
20
-
21
-
22
-
23
-
24
-
25
-
26
-
27
-
28
-
29
-
30
-
31
-
32
-
33
-
34
-
35
-
36
-
37
-
38
-
39
-
40
-
41
-
42
-
43
-
44
-
45
-
46
-
47
-
48
-
49
-
50
-
51
-
52
-
53
-
54
-
55
-
56
-
57
-
58
-
59
-
60
-
61
-
 62
62 -
 63
63 -
 64
64 -
 65
65 -
 66
66 -
 67
67 -
 68
68 -
 69
69 -
 70
70 -
 71
71 -
 72
72 -
 73
73 -
 74
74 -
 75
75 -
 76
76 -
 77
77 -
 78
78 -
 79
79 -
 80
80 -
 81
81 -
 82
82 -
83
-
84
-
85
-
86
-
87
-
88
-
89
-
90
-
91
-
92
-
93
-
94
-
95
-
96
-
97
-
98
-
99
-
100
-
101
-
102
-
103
-
104
-
105
-
106
-
107
-
108
-
109
-
110
-
111
-
112
-
113
-
114
-
115
-
116
-
117
-
118
-
119
-
120
-
121
-
122
-
123
-
124
-
125
-
126
-
127
-
128
-
129
-
130
-
131
-
132
-
133
-
134
-
135
-
136
-
137
-
138
-
139
-
140
-
141
-
142
-
143
-
144
-
145
-
146
-
147
-
148
-
149
-
150
-
151
-
152
-
153
-
154
-
155
-
156
-
157
-
158
-
159
-
160
-
161
-
162
-
163
-
164
-
165
-
166
-
167
-
168
-
169
-
170
-
171
-
172
-
173
-
174
-
175
-
176
-
177
-
178
-
179
-
180
 |
 |

70 Making energy more
Notes on financial statements continued
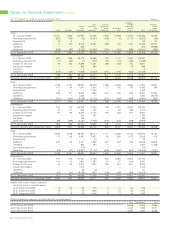
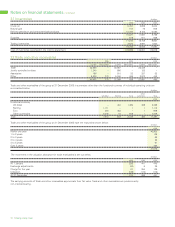
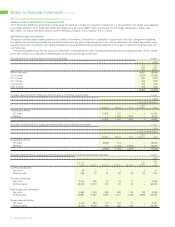
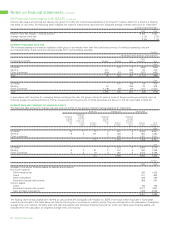
31 Inventories $ million
2005 2004 2003
Crude oil 5,457 3,659 2,044
Natural gas 164 75 605
Refined petroleum and petrochemicals products 10,700 8,103 6,080
16,321 11,837 8,729
Supplies 919 911 938
17,240 12,748 9,667
Trading inventories 2,520 2,897 1,930
19,760 15,645 11,597
Cost of inventories expensed in the income statement 172,699 135,907 115,978
32 Trade and other receivables $ million
2005 2004 2003
Current Non-current Current Non-current Current Non-current
Trade 33,565 – 30,657 – 23,449 –
Jointly controlled entities 1,345 – 886 – 122 –
Associates 186 – 210 23 337 53
Other 5,806 770 5,346 406 3,973 442
40,902 770 37,099 429 27,881 495
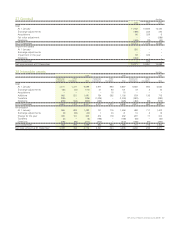
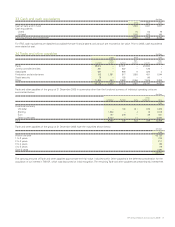
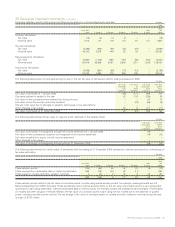
Trade and other receivables of the group at 31 December 2005 in currencies other than the functional currency of individual operating units are
summarized below.
$ million
Other
US dollar Sterling Euro currencies Total
2005
Functional currency
US dollar – 404 1,496 458 2,358
Sterling 1,111 – 1 1 1,113
Euro 354 453 – 1 808
Other currencies 6,045 15 948 – 7,008
To t al 7,510 872 2,445 460 11,287
Trade and other receivables of the group at 31 December 2005 have the maturities shown below.
$ million
2005
Within one year 40,902
1 to 2 years 129
2 to 3 years 82
3 to 4 years 56
4 to 5 years 51
Over 5 years 452
41,672
The movement in the valuation allowance for trade receivables is set out below.
$ million
2005 2004 2003
At 1 January 526 441 445
Exchange adjustments (30) 6 29
Charge for the year 67 254 139
Utilization (189) (175) (172)
At 31 December 374 526 441
The carrying amounts of Trade and other receivables approximate their fair value. Trade and other receivables are predominantly
non-interest bearing.