BP 2005 Annual Report Download - page 93
Download and view the complete annual report
Please find page 93 of the 2005 BP annual report below. You can navigate through the pages in the report by either clicking on the pages listed below, or by using the keyword search tool below to find specific information within the annual report.-
 1
1 -
2
-
3
-
4
-
5
-
6
-
7
-
8
-
9
-
10
-
11
-
12
-
13
-
14
-
15
-
16
-
17
-
18
-
19
-
20
-
21
-
22
-
23
-
24
-
25
-
26
-
27
-
28
-
29
-
30
-
31
-
32
-
33
-
34
-
35
-
36
-
37
-
38
-
39
-
40
-
41
-
42
-
43
-
44
-
45
-
46
-
47
-
48
-
49
-
50
-
51
-
52
-
53
-
54
-
55
-
56
-
57
-
58
-
59
-
60
-
61
-
62
-
63
-
64
-
65
-
66
-
67
-
68
-
69
-
70
-
71
-
72
-
73
-
74
-
75
-
76
-
77
-
78
-
79
-
80
-
81
-
82
-
 83
83 -
 84
84 -
 85
85 -
 86
86 -
 87
87 -
 88
88 -
 89
89 -
 90
90 -
 91
91 -
 92
92 -
 93
93 -
 94
94 -
 95
95 -
 96
96 -
 97
97 -
 98
98 -
 99
99 -
 100
100 -
 101
101 -
 102
102 -
 103
103 -
104
-
105
-
106
-
107
-
108
-
109
-
110
-
111
-
112
-
113
-
114
-
115
-
116
-
117
-
118
-
119
-
120
-
121
-
122
-
123
-
124
-
125
-
126
-
127
-
128
-
129
-
130
-
131
-
132
-
133
-
134
-
135
-
136
-
137
-
138
-
139
-
140
-
141
-
142
-
143
-
144
-
145
-
146
-
147
-
148
-
149
-
150
-
151
-
152
-
153
-
154
-
155
-
156
-
157
-
158
-
159
-
160
-
161
-
162
-
163
-
164
-
165
-
166
-
167
-
168
-
169
-
170
-
171
-
172
-
173
-
174
-
175
-
176
-
177
-
178
-
179
-
180
 |
 |

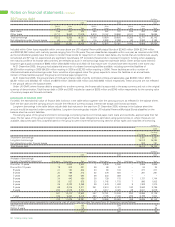
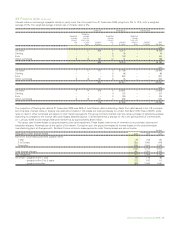
42 Pensions and other post-retirement benefits continued $ million
2003
US post-
UK US retirement
pension pension benefit Other
ANALYSIS OF THE AMOUNT CHARGED TO PROFIT BEFORE INTEREST AND TAXATION plans plans plans plans Total
Current service cost 290 177 54 116 637
Past service cost – 14 14 – 28
Settlement, curtailment and special termination benefits – (11) (669) 87 (593)
Payments to defined contribution plans – 134 – 36 170
Total operating charge (income) 290 314 (601) 239 242
Innovene operations (29) (23) (3) (19) (74)
Continuing operationsa261 291 (604) 220 168
ANALYSIS OF THE AMOUNT CREDITED (CHARGED) TO OTHER FINANCE EXPENSE
Expected return on plan assets 1,053 351 2 94 1,500
Interest on plan liabilities (848) (432) (259) (301) (1,840)
Other finance income (expense) 205 (81) (257) (207) (340)
Innovene operations (7) (2) 14 10 15
Continuing operations 198 (83) (243) (197) (325)
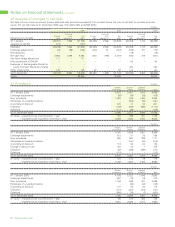
ANALYSIS OF THE AMOUNT RECOGNIZED IN THE STATEMENT OF RECOGNIZED
INCOME AND EXPENSE
Actual return less expected return on pension plan assets 1,639 749 2 2 2,392
Experience gains and losses arising on the plan liabilities 641 30 67 135 873
Change in assumptions underlying the present value of the plan liabilities (1,437) (1,030) (443) (279) (3,189)
Actuarial gain (loss) recognized in statement of recognized income and expense 843 (251) (374) (142) 76
MOVEMENT IN SURPLUS (DEFICIT) DURING THE YEAR
Benefit obligation at 1 January 14,822 6,765 4,326 5,141 31,054
Exchange adjustment 1,738 – – 910 2,648
Current service cost 290 177 54 116 637
Plan amendments – 14 14 – 28
Interest cost 848 432 259 301 1,840
Special termination benefits – (11) (669) 87 (593)
Contributions by plan participants 33 – – 2 35
Benefit payments (761) (668) (217) (325) (1,971)
Acquisitions – – – 1 1
Disposals – – – – –
Actuarial (gain) loss on obligation 796 1,000 376 144 2,316
Benefit obligation at 31 December 17,766 7,709 4,143 6,377 35,995
Fair value of plan assets at 1 January 15,138 4,206 33 1,447 20,824
Exchange adjustment 1,864 – – 222 2,086
Expected return on plan assets 1,053 351 2 94 1,500
Contributions by plan participants 33 – – 2 35
Contributions by employers (funded plans) 258 2,189 – 86 2,533
Contributions by employers (unfunded plans) – 30 213 209 452
Benefit payments (761) (668) (217) (325) (1,971)
Acquisitions – – – 2 2
Disposals – – – – –
Actuarial gain (loss) on plan assets 1,639 749 2 2 2,392
Fair value of plan assets at 31 December 19,224 6,857 33 1,739 27,853
Surplus (deficit) 1,458 (852) (4,110) (4,638) (8,142)
Represented by
Asset recognized 1,562 – – 118 1,680
Liability recognized (104) (852) (4,110) (4,756) (9,822)
1,458 (852) (4,110) (4,638) (8,142)
The surplus (deficit) may be analysed between wholly or partly funded and wholly
unfunded plans as follows
Funded 1,458 (494) (72) (308) 584
Unfunded – (358) (4.038) (4,330) (8,726)
1,458 (852) (4,110) (4,638) (8,142)
The defined benefit obligation may be analysed between wholly or partly funded and
wholly unfunded plans as follows
Funded (17,766) (7,351) (105) (2,047) (27,269)
Unfunded – (358) (4,038) (4,330) (8,726)
(17,766) (7,709) (4,143) (6,377) (35,995)
aIncluded within production and manufacturing expenses and distribution and administration expenses.
Pension and other post-retirement benefit surpluses and deficits are disclosed on a pre-tax basis. On a post-tax basis the pension and other post-retirement
benefit surplus (deficit) at 31 December 2005 would be $(4,770) million (2004 $(6,514) million and 2003 $(6,489) million).
BP Annual Report and Accounts 2005 91