BP 2005 Annual Report Download - page 8
Download and view the complete annual report
Please find page 8 of the 2005 BP annual report below. You can navigate through the pages in the report by either clicking on the pages listed below, or by using the keyword search tool below to find specific information within the annual report.-
 1
1 -
 2
2 -
 3
3 -
 4
4 -
 5
5 -
 6
6 -
 7
7 -
 8
8 -
 9
9 -
 10
10 -
 11
11 -
 12
12 -
 13
13 -
 14
14 -
 15
15 -
 16
16 -
 17
17 -
 18
18 -
 19
19 -
20
-
21
-
22
-
23
-
24
-
25
-
26
-
27
-
28
-
29
-
30
-
31
-
32
-
33
-
34
-
35
-
36
-
37
-
38
-
39
-
40
-
41
-
42
-
43
-
44
-
45
-
46
-
47
-
48
-
49
-
50
-
51
-
52
-
53
-
54
-
55
-
56
-
57
-
58
-
59
-
60
-
61
-
62
-
63
-
64
-
65
-
66
-
67
-
68
-
69
-
70
-
71
-
72
-
73
-
74
-
75
-
76
-
77
-
78
-
79
-
80
-
81
-
82
-
83
-
84
-
85
-
86
-
87
-
88
-
89
-
90
-
91
-
92
-
93
-
94
-
95
-
96
-
97
-
98
-
99
-
100
-
101
-
102
-
103
-
104
-
105
-
106
-
107
-
108
-
109
-
110
-
111
-
112
-
113
-
114
-
115
-
116
-
117
-
118
-
119
-
120
-
121
-
122
-
123
-
124
-
125
-
126
-
127
-
128
-
129
-
130
-
131
-
132
-
133
-
134
-
135
-
136
-
137
-
138
-
139
-
140
-
141
-
142
-
143
-
144
-
145
-
146
-
147
-
148
-
149
-
150
-
151
-
152
-
153
-
154
-
155
-
156
-
157
-
158
-
159
-
160
-
161
-
162
-
163
-
164
-
165
-
166
-
167
-
168
-
169
-
170
-
171
-
172
-
173
-
174
-
175
-
176
-
177
-
178
-
179
-
180
 |
 |

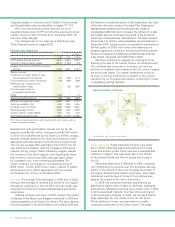
6 Making energy more
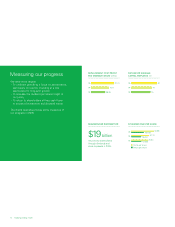
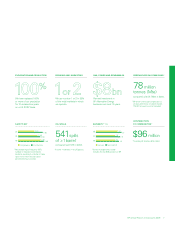
Measuring our progress
We have three targets:
••• To underpin growth by a focus on performance,
particularly on returns, investing at a rate
appropriate for long-term growth.
••• To increase the dividend per share in light of
our policy.
••• To return to shareholders all free cash flows
in excess of investment and dividend needs.
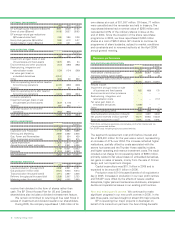
The charts opposite provide some measures of
our progress in 2005.
REPLACEMENT COST PROFIT
PER ORDINARY SHARE (cents)
05 91.41
04 70.71
03 56.06
RETURN ON AVERAGE
CAPITAL EMPLOYED (%)
05 20
04 16
03 15
34.85
05 19.152
27.70
04 15.251
25.50
03 15.658
Cents per share
Pence per share
DIVIDENDS PAID PER SHARE
SHAREHOLDER DISTRIBUTION
$
returned to shareholders
19 billion
through dividends and
share buybacks in 2005.