BP 2005 Annual Report Download - page 59
Download and view the complete annual report
Please find page 59 of the 2005 BP annual report below. You can navigate through the pages in the report by either clicking on the pages listed below, or by using the keyword search tool below to find specific information within the annual report.-
 1
1 -
2
-
3
-
4
-
5
-
6
-
7
-
8
-
9
-
10
-
11
-
12
-
13
-
14
-
15
-
16
-
17
-
18
-
19
-
20
-
21
-
22
-
23
-
24
-
25
-
26
-
27
-
28
-
29
-
30
-
31
-
32
-
33
-
34
-
35
-
36
-
37
-
38
-
39
-
40
-
41
-
42
-
43
-
44
-
45
-
46
-
47
-
48
-
 49
49 -
 50
50 -
 51
51 -
 52
52 -
 53
53 -
 54
54 -
 55
55 -
 56
56 -
 57
57 -
 58
58 -
 59
59 -
 60
60 -
 61
61 -
 62
62 -
 63
63 -
 64
64 -
 65
65 -
 66
66 -
 67
67 -
 68
68 -
 69
69 -
70
-
71
-
72
-
73
-
74
-
75
-
76
-
77
-
78
-
79
-
80
-
81
-
82
-
83
-
84
-
85
-
86
-
87
-
88
-
89
-
90
-
91
-
92
-
93
-
94
-
95
-
96
-
97
-
98
-
99
-
100
-
101
-
102
-
103
-
104
-
105
-
106
-
107
-
108
-
109
-
110
-
111
-
112
-
113
-
114
-
115
-
116
-
117
-
118
-
119
-
120
-
121
-
122
-
123
-
124
-
125
-
126
-
127
-
128
-
129
-
130
-
131
-
132
-
133
-
134
-
135
-
136
-
137
-
138
-
139
-
140
-
141
-
142
-
143
-
144
-
145
-
146
-
147
-
148
-
149
-
150
-
151
-
152
-
153
-
154
-
155
-
156
-
157
-
158
-
159
-
160
-
161
-
162
-
163
-
164
-
165
-
166
-
167
-
168
-
169
-
170
-
171
-
172
-
173
-
174
-
175
-
176
-
177
-
178
-
179
-
180
 |
 |

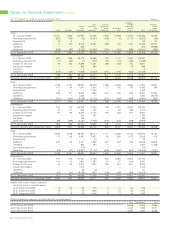
13 Impairment of goodwill $ million
2005 2004 2003
Exploration and Production 4,371 4,371 4,371
Refining and Marketing 5,955 6,418 6,151
Gas, Power and Renewables 45 43 49
Other businesses and corporate – 25 21
Goodwill as at 31 December 10,371 10,857 10,592
Goodwill acquired through business combinations has been allocated first to segments and then down to the next level of cash-generating unit
that is expected to benefit from the synergies of the acquisition. For Exploration and Production, goodwill has been allocated to each geographic
region, that is UK, Rest of Europe, US and Rest of World, and for Refining and Marketing, goodwill has been allocated to strategic performance
units (SPUs), namely Refining, Retail, Lubricants, Aromatics and Acetyls and Business Marketing.
In assessing whether goodwill has been impaired, the carrying amount of the cash-generating unit (including goodwill) is compared with the
recoverable amount of the cash-generating unit. The recoverable amount is the higher of fair value less costs to sell and value in use. In the
absence of any information about the fair value of a cash-generating unit, the recoverable amount is deemed to be the value in use.
The group generally estimates value in use using a discounted cash flow model. The future cash flows are usually adjusted for risks specific
to the asset and discounted using a pre-tax discount rate of 10% (2004 9% and 2003 9%). This discount rate is derived from the group’s post-tax
weighted average cost of capital. A different pre-tax discount rate is used where the local tax rate is significantly different from the UK or US
corporate tax rates.
The five-year group plan, which is approved on an annual basis by senior management, is the source for information for the determination of
the various values in use. It contains implicit forecasts for oil and natural gas production, refinery throughputs, sales volumes for various types
of refined products (e.g. gasoline and lubricants), revenues, costs and capital expenditure. As an initial step to the preparation of this plan, various
environmental assumptions, such as oil prices, natural gas prices, refining margins, refined product margins and cost inflation rates, are set by
senior management. These environmental assumptions take account of existing prices, global supply-demand equilibrium for oil and natural gas,
other macroeconomic factors and historical trends and variability.
For the purposes of impairment testing, the group’s oil price assumption is for the Brent oil price to drop from an average 2005 price of $55 per
barrel in equal annual steps over the next three years to $25 per barrel in 2009 and to remain flat thereafter (2004 $38 per barrel stepping down to
$20 per barrel in 2008 and beyond and 2003 $29 per barrel stepping down to $20 per barrel in 2007 and beyond). Similarly, Henry Hub natural gas
prices drop from an average $8.65 per mmBtu in 2005 to $4.00 per mmBtu in 2009 and beyond (2004 $6.15 per mmBtu stepping down to $3.50
per mmBtu in 2008 and beyond and 2003 $5.35 per mmBtu stepping down to $3.50 per mmBtu in 2007 and beyond). These prices are adjusted
to arrive at appropriate consistent price assumptions for different qualities of oil and gas.
EXPLORATION AND PRODUCTION
The value in use is based on the cash flows expected to be generated by the projected oil or natural gas production profiles up to the expected
dates of cessation of production of each producing field. The date of cessation of production depends on the interaction of a number of variables,
such as the recoverable quantities of hydrocarbons, the production profile of the hydrocarbons, the cost of the development of the infrastructure
necessary to recover the hydrocarbons, the production costs, the contractual duration of the production concession and the selling price of the
hydrocarbons produced. As each producing field has specific reservoir characteristics and economic circumstances, the cash flows of the fields are
computed using appropriate individual economic models and key assumptions agreed by BP’s management for the purpose. Cash outflows and
hydrocarbon production quantities for the first five years are agreed as part of the annual planning process. Thereafter, estimated production
quantities and cash outflows up to the date of cessation of production are developed to be consistent with this.
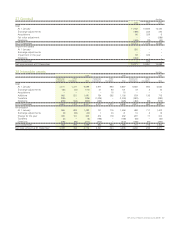
The following table shows the carrying value of the goodwill allocated to each of the regions of the Exploration and Production segment and
the amount by which the recoverable amount (value in use) exceeds the carrying amount of the goodwill and other non-current assets in the
cash-generating units to which the goodwill has been allocated. No impairment charge is required.
$ million
2005
Rest of Rest of
UK Europe USA World Total
Goodwill 341 – 3,515 515 4,371
Excess of recoverable amount over carrying amount 3,205 n/a 6,421 28,088 –
$ million
2004
Rest of Rest of
UK Europe USA World Total
Goodwill 341 – 3,515 515 4,371
Excess of recoverable amount over carrying amount 2,045 n/a 3,332 14,094 –
$ million
2003
Rest of Rest of
UK Europe USA World Total
Goodwill 341 – 3,515 515 4,371
Excess of recoverable amount over carrying amount 3,466 n/a 4,734 15,119 –
BP Annual Report and Accounts 2005 57