BP 2005 Annual Report Download - page 71
Download and view the complete annual report
Please find page 71 of the 2005 BP annual report below. You can navigate through the pages in the report by either clicking on the pages listed below, or by using the keyword search tool below to find specific information within the annual report.-
 1
1 -
2
-
3
-
4
-
5
-
6
-
7
-
8
-
9
-
10
-
11
-
12
-
13
-
14
-
15
-
16
-
17
-
18
-
19
-
20
-
21
-
22
-
23
-
24
-
25
-
26
-
27
-
28
-
29
-
30
-
31
-
32
-
33
-
34
-
35
-
36
-
37
-
38
-
39
-
40
-
41
-
42
-
43
-
44
-
45
-
46
-
47
-
48
-
49
-
50
-
51
-
52
-
53
-
54
-
55
-
56
-
57
-
58
-
59
-
60
-
 61
61 -
 62
62 -
 63
63 -
 64
64 -
 65
65 -
 66
66 -
 67
67 -
 68
68 -
 69
69 -
 70
70 -
 71
71 -
 72
72 -
 73
73 -
 74
74 -
 75
75 -
 76
76 -
 77
77 -
 78
78 -
 79
79 -
 80
80 -
 81
81 -
82
-
83
-
84
-
85
-
86
-
87
-
88
-
89
-
90
-
91
-
92
-
93
-
94
-
95
-
96
-
97
-
98
-
99
-
100
-
101
-
102
-
103
-
104
-
105
-
106
-
107
-
108
-
109
-
110
-
111
-
112
-
113
-
114
-
115
-
116
-
117
-
118
-
119
-
120
-
121
-
122
-
123
-
124
-
125
-
126
-
127
-
128
-
129
-
130
-
131
-
132
-
133
-
134
-
135
-
136
-
137
-
138
-
139
-
140
-
141
-
142
-
143
-
144
-
145
-
146
-
147
-
148
-
149
-
150
-
151
-
152
-
153
-
154
-
155
-
156
-
157
-
158
-
159
-
160
-
161
-
162
-
163
-
164
-
165
-
166
-
167
-
168
-
169
-
170
-
171
-
172
-
173
-
174
-
175
-
176
-
177
-
178
-
179
-
180
 |
 |

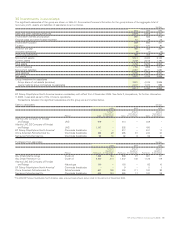
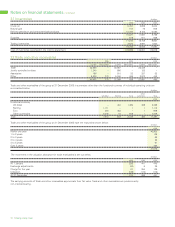
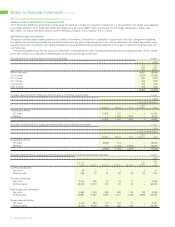
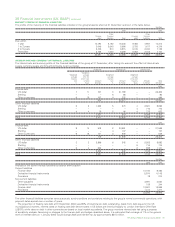
30 Investments in associates
The significant associates of the group are shown in Note 51. Summarized financial information for the group’s share of the aggregate total of
revenues, profit, assets and liabilities of associates is set out below.
$ million
2005 2004 2003
Sales and other operating revenues 6,879 5,509 4,101
Profit before interest and taxation 665 632 513
Finance costs and other finance expense 57 48 42
Profit before taxation 608 584 471
Taxation 143 121 80
Profit for the year 465 463 391
Innovene operations (5) (1) (3)
Continuing operations 460 462 388
Non-current assets 5,514 6,023 5,143
Current assets 2,248 2,212 1,720
Total assets 7,762 8,235 6,863
Current liabilities 1,755 1,988 1,614
Non-current liabilities 2,037 2,171 1,280
Total liabilities 3,792 4,159 2,894
Net assets 3,970 4,076 3,969
Group investment in associates
Group share of net assets (as above) 3,970 4,076 3,969
Loans made by group companies to associates 2,247 1,410 899
6,217 5,486 4,868
BP Solvay Polyethylene North America became a subsidiary with effect from 2 November 2004. See Note 3, Acquisitions, for further information.
In 2005, it was sold as part of the Innovene operations.
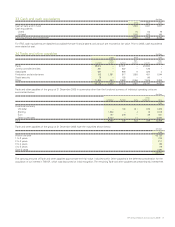
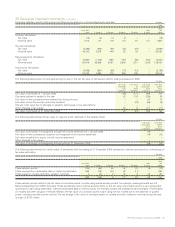
Transactions between the significant associates and the group are summarized below.
Sales to associates $ million
2005 2004 2003
Amount Amount Amount
receivable at receivable at receivable at
Product Sales 31 December Sales 31 December Sales 31 December
Atlantic LNG Company of Trinidad
and Tobago LNG 579 – 414 – 348 –
Atlantic LNG 2/3 Company of Trinidad
and Tobago LNG 1,157 – 532 – 420 –
BP Solvay Polyethylene North AmericaaChemicals feedstocks – – 217 – 241 17
China American Petrochemical Co. Chemicals feedstocks 393 48 385 81 240 67
Samsung Petrochemical Co. Chemicals feedstocks 92 13 62 8 55 10
Purchases from associates $ million
2005 2004 2003
Amount Amount Amount
payable at payable at payable at
Product Purchases 31 December Purchases 31 December Purchases 31 December
Abu Dhabi Marine Areas Crude oil 1,355 164 866 91 661 61
Abu Dhabi Petroleum Co. Crude oil 2,260 214 1,547 145 1,122 118
Atlantic LNG 2/3 Company of Trinidad
and Tobago Natural gas 190 – 120 – 83 10
BP Solvay Polyethylene North AmericaaChemicals feedstocks – – 9 – 11 1
China American Petrochemical Co. Petrochemicals 547 109 455 111 197 83
Samsung Petrochemical Co. Chemicals feedstocks 626 140 290 17 187 38
aThe 2004 BP Solvay Polyethylene North America sales and purchases shown above relate to the period to 2 November 2004.
BP Annual Report and Accounts 2005 69