BP 2005 Annual Report Download - page 74
Download and view the complete annual report
Please find page 74 of the 2005 BP annual report below. You can navigate through the pages in the report by either clicking on the pages listed below, or by using the keyword search tool below to find specific information within the annual report.-
 1
1 -
2
-
3
-
4
-
5
-
6
-
7
-
8
-
9
-
10
-
11
-
12
-
13
-
14
-
15
-
16
-
17
-
18
-
19
-
20
-
21
-
22
-
23
-
24
-
25
-
26
-
27
-
28
-
29
-
30
-
31
-
32
-
33
-
34
-
35
-
36
-
37
-
38
-
39
-
40
-
41
-
42
-
43
-
44
-
45
-
46
-
47
-
48
-
49
-
50
-
51
-
52
-
53
-
54
-
55
-
56
-
57
-
58
-
59
-
60
-
61
-
62
-
63
-
 64
64 -
 65
65 -
 66
66 -
 67
67 -
 68
68 -
 69
69 -
 70
70 -
 71
71 -
 72
72 -
 73
73 -
 74
74 -
 75
75 -
 76
76 -
 77
77 -
 78
78 -
 79
79 -
 80
80 -
 81
81 -
 82
82 -
 83
83 -
 84
84 -
85
-
86
-
87
-
88
-
89
-
90
-
91
-
92
-
93
-
94
-
95
-
96
-
97
-
98
-
99
-
100
-
101
-
102
-
103
-
104
-
105
-
106
-
107
-
108
-
109
-
110
-
111
-
112
-
113
-
114
-
115
-
116
-
117
-
118
-
119
-
120
-
121
-
122
-
123
-
124
-
125
-
126
-
127
-
128
-
129
-
130
-
131
-
132
-
133
-
134
-
135
-
136
-
137
-
138
-
139
-
140
-
141
-
142
-
143
-
144
-
145
-
146
-
147
-
148
-
149
-
150
-
151
-
152
-
153
-
154
-
155
-
156
-
157
-
158
-
159
-
160
-
161
-
162
-
163
-
164
-
165
-
166
-
167
-
168
-
169
-
170
-
171
-
172
-
173
-
174
-
175
-
176
-
177
-
178
-
179
-
180
 |
 |

72 Making energy more
Notes on financial statements continued
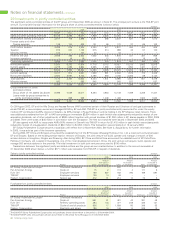
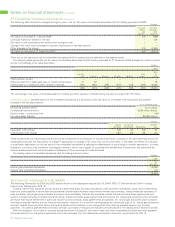
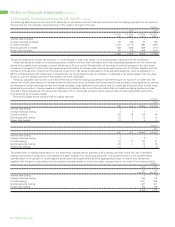
35 Derivative financial instruments
An outline of the group’s financial risks and the policies and objectives pursued in relation to those risks is set out in the financial risk management
section on pages 24-26.
This note contains the disclosures required by IAS 32 for derivative financial instruments. IAS 39 prescribes strict criteria for hedge accounting,
whether as a cash flow or fair value hedge, and requires that any derivative that does not meet these criteria should be classified as trading and
marked-to-market. BP adopted IAS 32 and IAS 39 with effect from 1 January 2005 without restating prior periods. Consequently, the group’s
accounting policy under UK GAAP has been used for 2004 and 2003. The policy under UK GAAP and the disclosures required by UK GAAP for
derivative financial instruments are shown in Note 37.
In the normal course of business the group is a party to derivative financial instruments (derivatives) with off-balance sheet risk, primarily to
manage its exposure to fluctuations in foreign currency exchange rates and interest rates, including management of the balance between floating
rate and fixed rate debt. The group also manages certain of its exposures to movements in oil, natural gas and power prices. In addition, the group
trades derivatives in conjunction with these risk management activities.
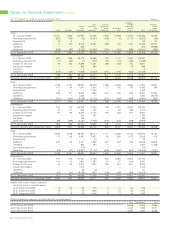
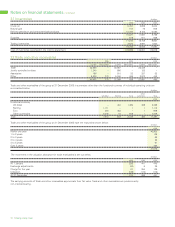
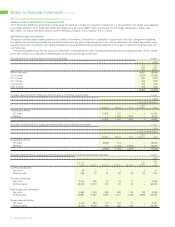
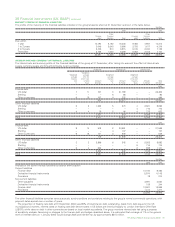
The fair value of derivative financial instruments at 31 December 2005 are set out below.
$ million
2005
Fair Contractual Fair Contractual
value or notional value or notional
asset amounts liability amounts
Cash flow hedges
Currency forwards, futures and swaps 34 666 (94) 3,100
Currency options – 693 (35) 1,470
Commodity futures 57 274 – –
91 1,633 (129) 4,570
Fair value hedges
Currency forwards, futures and swaps 222 2,566 (124) 1,967
Interest rate swaps 19 324 (217) 7,521
241 2,890 (341) 9,488
Hedges of net investments in foreign entities 63 346 – –
Derivatives held for trading
Currency derivatives 41 634 (18) 1,687
Oil derivatives 2,765 56,394 (2,826) 52,524
Natural gas derivatives 6,836 148,794 (6,307) 128,330
Power derivatives 3,341 25,793 (3,158) 26,618
12,983 231,615 (12,309) 209,159
13,378 236,484 (12,779) 223,217
Of which – current 3,652 (9,083)
– non-current 9,726 (3,696)
Embedded derivatives held for trading
Natural gas contracts 587 4,620 (3,098) 8,563
Interest rate contracts – – (30) 150
587 4,620 (3,128) 8,713
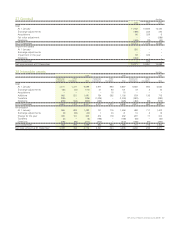
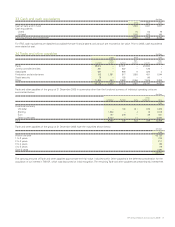
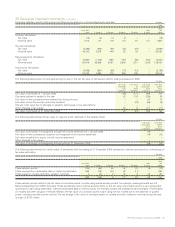
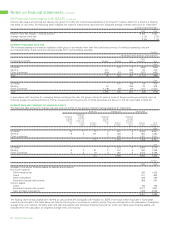
CASH FLOW HEDGES
At 31 December 2005, the group held forward currency contracts, cylinders and options that were being used to hedge the foreign currency risk of
highly probable transactions. Changes in the fair value of instruments used as hedges are not recognized in the accounts until the position matures.
The hedges were assessed to be highly effective.
An analysis of these changes in fair value is as follows:
$ million
Net fair value
Fair value of cash flow hedges at 1 January 2005 198
Change in fair value during the year (191)
Fair value recognized in income statement during the year (8)
Fair value on capital expenditure hedging recycled into carrying value of assets during the year (37)
Fair value of cash flow hedges at 31 December 2005 (38)
Cash flow hedges have the following maturities: $ million
2005
Fair value Fair value
asset liability
Within one year 54 (108)
1 to 2 years 19 (17)
2 to 3 years 3 (3)
3 to 4 years 6 (1)
4 to 5 years 2 –
Over 5 years 7 –
91 (129)