BP 2005 Annual Report Download - page 76
Download and view the complete annual report
Please find page 76 of the 2005 BP annual report below. You can navigate through the pages in the report by either clicking on the pages listed below, or by using the keyword search tool below to find specific information within the annual report.-
 1
1 -
2
-
3
-
4
-
5
-
6
-
7
-
8
-
9
-
10
-
11
-
12
-
13
-
14
-
15
-
16
-
17
-
18
-
19
-
20
-
21
-
22
-
23
-
24
-
25
-
26
-
27
-
28
-
29
-
30
-
31
-
32
-
33
-
34
-
35
-
36
-
37
-
38
-
39
-
40
-
41
-
42
-
43
-
44
-
45
-
46
-
47
-
48
-
49
-
50
-
51
-
52
-
53
-
54
-
55
-
56
-
57
-
58
-
59
-
60
-
61
-
62
-
63
-
64
-
65
-
 66
66 -
 67
67 -
 68
68 -
 69
69 -
 70
70 -
 71
71 -
 72
72 -
 73
73 -
 74
74 -
 75
75 -
 76
76 -
 77
77 -
 78
78 -
 79
79 -
 80
80 -
 81
81 -
 82
82 -
 83
83 -
 84
84 -
 85
85 -
 86
86 -
87
-
88
-
89
-
90
-
91
-
92
-
93
-
94
-
95
-
96
-
97
-
98
-
99
-
100
-
101
-
102
-
103
-
104
-
105
-
106
-
107
-
108
-
109
-
110
-
111
-
112
-
113
-
114
-
115
-
116
-
117
-
118
-
119
-
120
-
121
-
122
-
123
-
124
-
125
-
126
-
127
-
128
-
129
-
130
-
131
-
132
-
133
-
134
-
135
-
136
-
137
-
138
-
139
-
140
-
141
-
142
-
143
-
144
-
145
-
146
-
147
-
148
-
149
-
150
-
151
-
152
-
153
-
154
-
155
-
156
-
157
-
158
-
159
-
160
-
161
-
162
-
163
-
164
-
165
-
166
-
167
-
168
-
169
-
170
-
171
-
172
-
173
-
174
-
175
-
176
-
177
-
178
-
179
-
180
 |
 |

74 Making energy more
Notes on financial statements continued
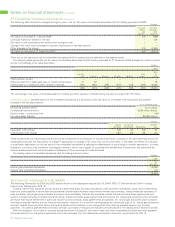
35 Derivative financial instruments continued
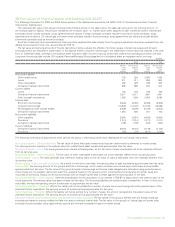
HEDGES OF NET INVESTMENTS IN FOREIGN ENTITIES
At 31 December 2005, the group held currency swap contracts as a hedge of a long-term investment in a UK subsidiary. The hedge was assessed
to be highly effective. At 31 December 2005, the hedge had a fair value of $63 million and the gain on the hedge recognized in equity was
$58 million. US dollars have been sold forward for sterling purchased, with a maturity of 3 to 4 years.
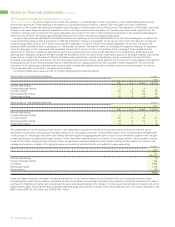
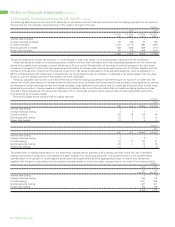
DERIVATIVES HELD FOR TRADING
The group maintains active trading positions in a variety of derivatives. This activity is undertaken in conjunction with risk management activities.
Derivatives held for trading purposes are marked-to-market and any gain or loss recognized in the income statement. For traded derivatives, many
positions have been neutralized, with trading initiatives being concluded by taking opposite positions to fix a gain or loss, thereby achieving a zero
net market risk.
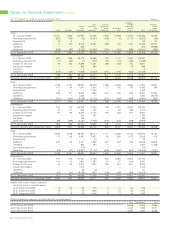
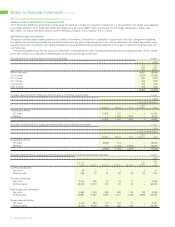
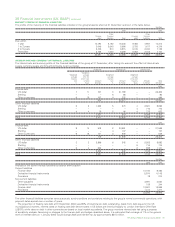
The following table shows the fair value at 31 December of derivatives and other financial instruments held for trading purposes. The fair values
at the year end are not materially unrepresentative of the position throughout the year.
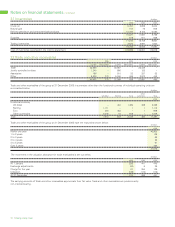
Derivatives held for trading have the following maturities: $ million
2005
Fair Fair
value value
asset liability
Within one year 9,487 (8,924)
1 to 2 years 2,019 (2,155)
2 to 3 years 685 (677)
3 to 4 years 455 (278)
4 to 5 years 145 (121)
Over 5 years 192 (154)
12,983 (12,309)
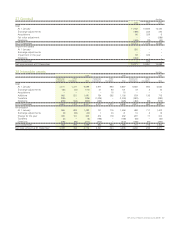
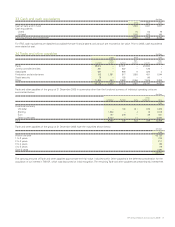
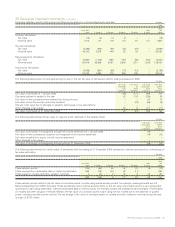
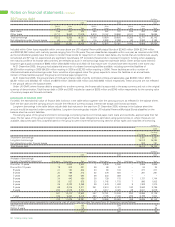
Derivative assets held for trading are denominated in the following currencies: $ million
2005
Currency of denomination
Other
US dollar Sterling Euro currencies Total
Functional currency
US dollar 10,232 137 – 4 10,373
Sterling – 1,106 1,504 – 2,610
10,232 1,243 1,504 4 12,983
Derivative liabilities held for trading are denominated in the following currencies: $ million
2005
Currency of denomination
Other
US dollar Sterling Euro currencies Total
Functional currency
US dollar (9,223) (110) – – (9,333)
Sterling – (1,453) (1,523) – (2,976)
(9,223) (1,563) (1,523) – (12,309)
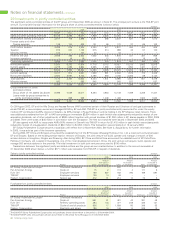
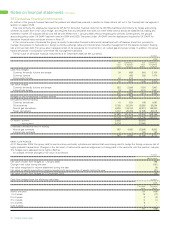
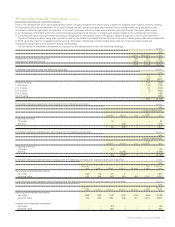
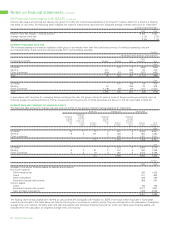
Derivative assets held for trading have the following contractual or notional values and maturities: $ million
2005
Total
Less than Over fair
1 year 1-2 years 2-3 years 3-4 years 4-5 years 5 years value
Currency derivatives
Fair value 286111441
Notional value 358 73 51 28 32 92 634
Oil price derivatives
Fair value 2,476 225 37 19 8 – 2,765
Notional value 52,260 3,378 676 45 35 – 56,394
Natural gas price derivatives
Fair value 4,509 1,194 528 292 125 188 6,836
Notional value 113,897 17,562 8,560 4,021 2,068 2,686 148,794
Power price derivatives
Fair value 2,474 594 119 143 11 – 3,341
Notional value 19,149 5,049 857 535 196 – 25,786