BP 2005 Annual Report Download - page 170
Download and view the complete annual report
Please find page 170 of the 2005 BP annual report below. You can navigate through the pages in the report by either clicking on the pages listed below, or by using the keyword search tool below to find specific information within the annual report.-
 1
1 -
2
-
3
-
4
-
5
-
6
-
7
-
8
-
9
-
10
-
11
-
12
-
13
-
14
-
15
-
16
-
17
-
18
-
19
-
20
-
21
-
22
-
23
-
24
-
25
-
26
-
27
-
28
-
29
-
30
-
31
-
32
-
33
-
34
-
35
-
36
-
37
-
38
-
39
-
40
-
41
-
42
-
43
-
44
-
45
-
46
-
47
-
48
-
49
-
50
-
51
-
52
-
53
-
54
-
55
-
56
-
57
-
58
-
59
-
60
-
61
-
62
-
63
-
64
-
65
-
66
-
67
-
68
-
69
-
70
-
71
-
72
-
73
-
74
-
75
-
76
-
77
-
78
-
79
-
80
-
81
-
82
-
83
-
84
-
85
-
86
-
87
-
88
-
89
-
90
-
91
-
92
-
93
-
94
-
95
-
96
-
97
-
98
-
99
-
100
-
101
-
102
-
103
-
104
-
105
-
106
-
107
-
108
-
109
-
110
-
111
-
112
-
113
-
114
-
115
-
116
-
117
-
118
-
119
-
120
-
121
-
122
-
123
-
124
-
125
-
126
-
127
-
128
-
129
-
130
-
131
-
132
-
133
-
134
-
135
-
136
-
137
-
138
-
139
-
140
-
141
-
142
-
143
-
144
-
145
-
146
-
147
-
148
-
149
-
150
-
151
-
152
-
153
-
154
-
155
-
156
-
157
-
158
-
159
-
 160
160 -
 161
161 -
 162
162 -
 163
163 -
 164
164 -
 165
165 -
 166
166 -
 167
167 -
 168
168 -
 169
169 -
 170
170 -
 171
171 -
 172
172 -
 173
173 -
 174
174 -
 175
175 -
 176
176 -
 177
177 -
 178
178 -
 179
179 -
 180
180
 |
 |

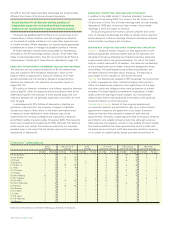
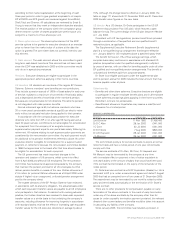
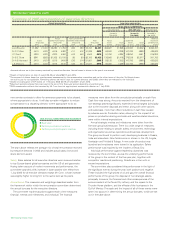
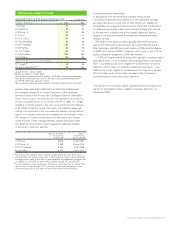
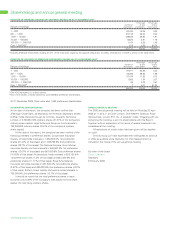
Summary of 2005 remuneration of executive directors
Annual remuneration Long-term remuneration
Share element of EDIP/LTPPs
2002-2004 plan 2003-2005 plan 2005-2007 plan
(vested in (to vest in (awarded in
Feb 2005) Feb 2006) Apr 2005)
Annual Non-cash benefits Potential
Salary performance bonus and other emoluments Total Actual Expected maximum
(thousand) (thousand) (thousand) (thousand) shares Valueashares Valuecperformance
2004 2005 2004 2005 2004 2005 2004 2005 vested (thousand) to vestb(thousand) sharesd
Lord Browne £1,382 £1,451 £2,280 £1,750 £82 £90 £3,744 £3,291 356,667 £1,958 474,384 £3,202 2,006,767
Dr D C Allen £410 £431 £615 £480 £11 £12 £1,036 £923 60,000 £329 147,783 £998 436,623
I C Conne£200 £421 £300 £450 £42 £43 £542 £914 51,750 £284 68,250 £461 415,832
Dr B E Grote $841 $923 $1,262 $1,100 $0 $0 $2,103 $2,023 136,960 $1,419 175,229 $2,077 501,782
Dr A B Hayward £410 £431 £615 £460 £36 £14 £1,061 £905 55,125 £303 147,783 £998 436,623
J A Manzoni £410 £431 £615 £440 £46 £47 £1,071 £918 60,000 £329 147,783 £998 436,623
Amounts shown are in the currency received by executive directors. Annual bonus is shown in the year it was earned.
aBased on market price on date of award (£5.49 per share/$62.15 per ADS).
bGross award of shares based on a performance assessment by the remuneration committee and on the other terms of the plan. Sufficient shares
are sold to pay for tax applicable. Remaining shares are held in trust for current directors until 2009, when they are released to the individual.
cBased on closing price of BP shares on 1 February 2006 (£6.75 per share/$71.12 per ADS).
dMaximum potential shares that could vest at the end of the three-year period depending on performance.
e2004 remuneration reflects that received by Mr Conn from his appointment as executive director on 1 July 2004.
new service contracts to allow for severance payments to be phased,
where appropriate to do so. It will also consider mitigation to reduce
compensation to a departing director, where appropriate to do so.
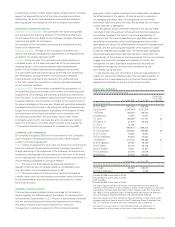
The chart above reflects the average mix of total remuneration received
by executive directors in 2005 and includes actual salary, bonus and
share element award.
Salary Base salaries for all executive directors were reviewed relative
to top Europe-based global companies and the US oil and gas sector.
Having taken account of market movements and performance, the
committee awarded a 5% increase in base salaries with effect from
1 July 2005 for all exective directors except Mr Conn, whose increase
was slightly higher to bring him to the same level as his peers.
Annual bonus The measures and weightings described earlier form
the framework within which the remuneration committee determined
the annual bonuses for the executive directors.
The committee made evaluations against each of the measures:
financial, metrics and milestones, and individual. The financial
Base salary
Performance-related annual bonus
Performance-related long-term incentives
2005 ACTUAL REMUNERATION ELEMENTS
measures were taken from the annual plan principally on cash flow.
Cash flow was strong. Amounts received from the divestment of
non-strategic assets significantly exceeded internal targets (principally
due to the Innovene disposal) and these, along with other actions
and successes, more than offset reductions in cash flow caused
by adverse events. Production rates, allowing for the impact of oil
prices on production-sharing contracts and weather-related downtime,
were within internal expectations.
Annual strategic metrics and milestones were taken from the
five-year group business plan. There is a wide range of measures,
including those relating to people, safety, environment, technology
and organization as well as operations and business development.
The group continued to perform well, developing business in Russia,
India and elsewhere. New fields came on stream in the US, Angola,
Azerbaijan and Trinidad & Tobago. A new code of conduct was
launched and employees were trained in its application. Safety
performance was impaired by the incident at Texas City.
Individual performance against leadership objectives was
reviewed by the committee, as was the underlying performance
of the group in the context of the five-year plan, together with
competitor results and positioning. Results are in line with or
exceed expectations.
The committee also considered this performance in the light of
the significant events during the year, both positive and negative.
These included the high prices of oil and gas; the overall financial
performance of the group; the disposal of non-strategic assets,
principally Innovene; the financial and other consequences of the
serious incident at the Texas City refinery and the repairs to the
Thunder Horse platform; and the effects of the hurricanes in the
Gulf of Mexico. The scale and the impact of all of these events were
taken into account in determining the annual bonuses, which are set
out in the table above.
168 Making energy more
Information subject to audit