BP 2005 Annual Report Download - page 62
Download and view the complete annual report
Please find page 62 of the 2005 BP annual report below. You can navigate through the pages in the report by either clicking on the pages listed below, or by using the keyword search tool below to find specific information within the annual report.-
 1
1 -
2
-
3
-
4
-
5
-
6
-
7
-
8
-
9
-
10
-
11
-
12
-
13
-
14
-
15
-
16
-
17
-
18
-
19
-
20
-
21
-
22
-
23
-
24
-
25
-
26
-
27
-
28
-
29
-
30
-
31
-
32
-
33
-
34
-
35
-
36
-
37
-
38
-
39
-
40
-
41
-
42
-
43
-
44
-
45
-
46
-
47
-
48
-
49
-
50
-
51
-
 52
52 -
 53
53 -
 54
54 -
 55
55 -
 56
56 -
 57
57 -
 58
58 -
 59
59 -
 60
60 -
 61
61 -
 62
62 -
 63
63 -
 64
64 -
 65
65 -
 66
66 -
 67
67 -
 68
68 -
 69
69 -
 70
70 -
 71
71 -
 72
72 -
73
-
74
-
75
-
76
-
77
-
78
-
79
-
80
-
81
-
82
-
83
-
84
-
85
-
86
-
87
-
88
-
89
-
90
-
91
-
92
-
93
-
94
-
95
-
96
-
97
-
98
-
99
-
100
-
101
-
102
-
103
-
104
-
105
-
106
-
107
-
108
-
109
-
110
-
111
-
112
-
113
-
114
-
115
-
116
-
117
-
118
-
119
-
120
-
121
-
122
-
123
-
124
-
125
-
126
-
127
-
128
-
129
-
130
-
131
-
132
-
133
-
134
-
135
-
136
-
137
-
138
-
139
-
140
-
141
-
142
-
143
-
144
-
145
-
146
-
147
-
148
-
149
-
150
-
151
-
152
-
153
-
154
-
155
-
156
-
157
-
158
-
159
-
160
-
161
-
162
-
163
-
164
-
165
-
166
-
167
-
168
-
169
-
170
-
171
-
172
-
173
-
174
-
175
-
176
-
177
-
178
-
179
-
180
 |
 |

60 Making energy more
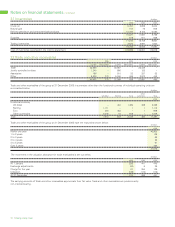
Notes on financial statements continued
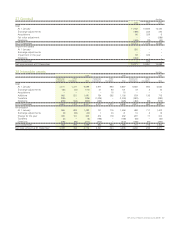
17 Operating leases continued
The minimum future lease payments (before deducting related rental income from operating sub-leases of $718 million) were as follows:
$ million
2005 2004 2003
Payable within
1 year 1,643 1,534 1,369
2 to 5 years 4,666 3,778 3,783
Thereafter 4,579 3,275 3,572
10,888 8,587 8,724
The group has entered into operating leases on ships, plant and machinery, commercial vehicles, land and buildings, including service station sites
and office accommodation. The ship leases represent approximately 52% of the minimum future lease payments. The typical durations of the
leases are as follows:
Years
Ships up to 25
Plant and machinery up to 10
Commercial vehicles up to 15
Land and buildings up to 40
Generally these leases have no renewal options. There are no financial restrictions placed upon the lessee by entering into these leases. The group
also routinely enters into time charters and spot charters for ships on standard industry terms.
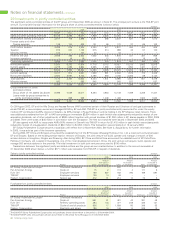
18 Exploration for and evaluation of oil and natural gas resources
The following financial information represents the amounts included within the corresponding group and Exploration and Production segment totals
for the exploration for and evaluation of oil and natural gas resources activity.
$ million
2005 2004 2003
Exploration and evaluation costs
Exploration expenditure written off 305 274 297
Other exploration costs 379 363 245
Exploration expense for the year 684 637 542
Intangible assets 4,008 3,761 4,236
Net assets 4,008 3,761 4,236
Capital expenditure 950 754 579
Net cash used in operating activities 379 363 245
Net cash used in investing activities 950 754 579
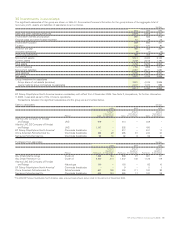
19 Auditors’ remuneration $ million
2005 2004 2003
Audit fees – Ernst & Young UK Total UK Total UK Total
Group audit 25 47 13 27 8 18
Audit-related regulatory reporting 3 6 4 7 2 5
Statutory audit of subsidiaries 7 23 4 16 3 13
35 76 21 50 13 36
Innovene operations (8) (8) (2) (2) (2) (2)
Continuing operations 27 68 19 48 11 34
Fees for other services – Ernst & Young
Further assurance services
Acquisition and disposal due diligence 2 2 6 7 9 9
Pension scheme audits – 1 – 1 – 1
Other further assurance services 6 7 6 9 5 9
Tax services
Compliance services 5 10 3 13 3 17
Advisory services – – – 1 – 2
13 20 15 31 17 38
Innovene operations – (1) – (1) – –
Continuing operations 13 19 15 30 17 38
Audit fees for 2005 include $4 million of additional fees for 2004. Audit fees are included in the income statement within distribution and
administration expenses.
The audit committee has established pre-approval policies and procedures for the engagement of Ernst & Young to render audit and certain
assurance and tax services. The audit fees payable to Ernst & Young are reviewed by the audit committee in the context of other global companies
for cost-effectiveness. Ernst & Young performed further assurance and tax services that were not prohibited by regulatory or other professional
requirements and were pre-approved by the committee. Ernst & Young is engaged for these services when its expertise and experience of BP
are important. Most of this work is of an audit nature. Tax services were awarded either through a full competitive tender process or following an
assessment of the expertise of Ernst & Young relative to that of other potential service providers. These services are for a fixed term.
Fees paid to major firms of accountants other than Ernst & Young for other services amount to $151 million (2004 $82 million and 2003 $44 million).