BP 2005 Annual Report Download - page 86
Download and view the complete annual report
Please find page 86 of the 2005 BP annual report below. You can navigate through the pages in the report by either clicking on the pages listed below, or by using the keyword search tool below to find specific information within the annual report.-
 1
1 -
2
-
3
-
4
-
5
-
6
-
7
-
8
-
9
-
10
-
11
-
12
-
13
-
14
-
15
-
16
-
17
-
18
-
19
-
20
-
21
-
22
-
23
-
24
-
25
-
26
-
27
-
28
-
29
-
30
-
31
-
32
-
33
-
34
-
35
-
36
-
37
-
38
-
39
-
40
-
41
-
42
-
43
-
44
-
45
-
46
-
47
-
48
-
49
-
50
-
51
-
52
-
53
-
54
-
55
-
56
-
57
-
58
-
59
-
60
-
61
-
62
-
63
-
64
-
65
-
66
-
67
-
68
-
69
-
70
-
71
-
72
-
73
-
74
-
75
-
 76
76 -
 77
77 -
 78
78 -
 79
79 -
 80
80 -
 81
81 -
 82
82 -
 83
83 -
 84
84 -
 85
85 -
 86
86 -
 87
87 -
 88
88 -
 89
89 -
 90
90 -
 91
91 -
 92
92 -
 93
93 -
 94
94 -
 95
95 -
 96
96 -
97
-
98
-
99
-
100
-
101
-
102
-
103
-
104
-
105
-
106
-
107
-
108
-
109
-
110
-
111
-
112
-
113
-
114
-
115
-
116
-
117
-
118
-
119
-
120
-
121
-
122
-
123
-
124
-
125
-
126
-
127
-
128
-
129
-
130
-
131
-
132
-
133
-
134
-
135
-
136
-
137
-
138
-
139
-
140
-
141
-
142
-
143
-
144
-
145
-
146
-
147
-
148
-
149
-
150
-
151
-
152
-
153
-
154
-
155
-
156
-
157
-
158
-
159
-
160
-
161
-
162
-
163
-
164
-
165
-
166
-
167
-
168
-
169
-
170
-
171
-
172
-
173
-
174
-
175
-
176
-
177
-
178
-
179
-
180
 |
 |

84 Making energy more
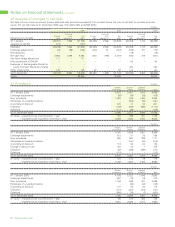
Notes on financial statements continued
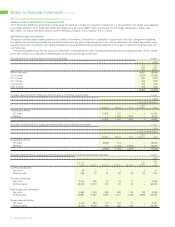
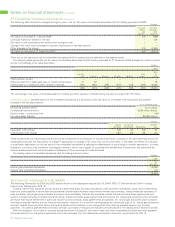
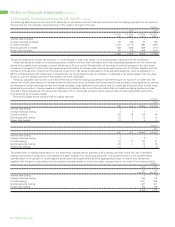
39 Finance debt $ million
2005 2004 2003
Within After Within After Within After
1 year 1 year Total 1 year 1 year Total 1 year 1 year Total
Bank loans 155 547 702 250 457 707 205 253 458
Other loans 8,717 8,962 17,679 9,819 10,167 19,986 9,161 10,524 19,685
Total borrowings 8,872 9,509 18,381 10,069 10,624 20,693 9,366 10,777 20,143
Net obligations under finance leases 60 721 781 115 2,283 2,398 90 2,092 2,182
8,932 10,230 19,162 10,184 12,907 23,091 9,456 12,869 22,325
Included within Other loans repayable within one year above are US Industrial Revenue/Municipal Bonds of $2,462 million (2004 $2,344 million
and 2003 $2,362 million) with maturity periods ranging from 2 to 35 years. They are classified as repayable within one year, as required under IFRS,
as the bondholders typically have the option to tender these bonds for repayment on interest reset dates. Any bonds that are tendered are usually
remarketed and BP has not experienced any significant repurchases. BP considers these bonds to represent long-term funding when assessing
the maturity profile of its finance debt and they are reflected as such in the borrowings repayment schedule below. Other similar loans linked to
long-term gas supply contracts of $992 million (2004 $280 million and 2003 nil) that mature over 10 years have been reported in the same way.
At 31 December 2005, the group had substantial amounts of undrawn borrowing facilities available, including committed facilities of
$4,500 million expiring in 2006 ($4,500 million expiring in 2005 and $3,700 million expiring in 2004). These facilities are with a number of
international banks and borrowings under them would be at pre-agreed rates. The group expects to renew the facilities on an annual basis.
Certain of these facilities support the group’s commercial paper programme.
At 31 December 2005, the group’s share of third-party finance debt of jointly controlled entities and associates was $3,266 million (2004
$2,821 million and 2003 $2,151 million) and $970 million (2004 $1,048 million and 2003 $922 million) respectively. These amounts are not reflected
in the group’s debt on the balance sheet.
Under UK GAAP, where finance debt is swapped into another currency, the finance debt is accounted in the swap currency and not in the original
currency of denomination. Total finance debt in 2004 and 2003 included an asset of $835 million and $745 million respectively for the carrying value
of currency swaps and forward contracts.
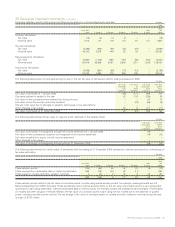
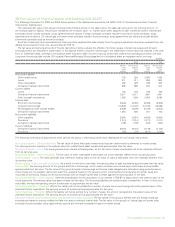
FAIR VALUES OF FINANCE DEBT
For 2005, the estimated fair value of finance debt is shown in the table below together with the carrying amount as reflected in the balance sheet.
Both the fair value and the carrying amount include the effects of currency swaps, interest rate swaps and forward contracts.
Long-term borrowings in the table below include debt that matures in the year from 31 December 2005, whereas in the balance sheet the
amount would be reported under current liabilities. Long-term borrowings also include US Industrial Revenue/Municipal Bonds classified on the
balance sheet as current liabilities.
The carrying value of the group’s short-term borrowings, comprising mainly commercial paper, bank loans and overdrafts, approximates their fair
value. The fair value of the group’s long-term borrowings and finance lease obligations is estimated using quoted prices or, where these are not
available, discounted cash flow analyses based on the group’s current incremental borrowing rates for similar types and maturities of borrowing.
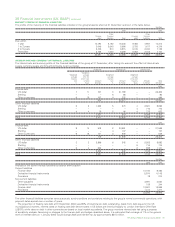
$ million
2005
Carrying
Fair value amount
Short-term borrowings 3,297 3,297
Long-term borrowings 15,313 15,084
Net obligations under finance leases 803 781
Total finance debt 19,413 19,162
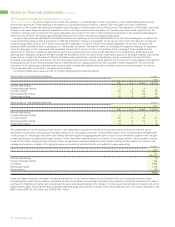
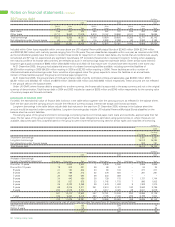
$ million
2005 2004 2003
Analysis of borrowings
by year of expected repayment Bank loans Other loans Total Bank loans Other loans Total Bank loans Other loans Total
Due after 10 years – 2,842 2,842 1 2,845 2,846 – 2,865 2,865
Due within 10 years 18 203 221 29 68 97 – 24 24
9 years 21 182 203 20 83 103 – 377 377
8 years 24 188 212 22 478 500 – 291 291
7 years 26 558 584 28 330 358 – – –
6 years 34 446 480 36 139 175 7 1,737 1,744
5 years 35 537 572 33 1,742 1,775 7 996 1,003
4 years 35 2,223 2,258 29 1,579 1,608 8 1,362 1,370
3 years 98 2,219 2,317 251 2,510 2,761 193 2,593 2,786
2 years 256 3,018 3,274 8 3,017 3,025 38 2,641 2,679
547 12,416 12,963 457 12,791 13,248 253 12,886 13,139
1 year 155 5,263 5,418 250 7,195 7,445 205 6,799 7,004
702 17,679 18,381 707 19,986 20,693 458 19,685 20,143
Amounts included above repayable by instalments, part of which falls due after five years from 31 December, are as follows:
After 5 years 192 204 14
Within 5 years 118 76 82
310 280 96