BP 2005 Annual Report Download - page 143
Download and view the complete annual report
Please find page 143 of the 2005 BP annual report below. You can navigate through the pages in the report by either clicking on the pages listed below, or by using the keyword search tool below to find specific information within the annual report.-
 1
1 -
2
-
3
-
4
-
5
-
6
-
7
-
8
-
9
-
10
-
11
-
12
-
13
-
14
-
15
-
16
-
17
-
18
-
19
-
20
-
21
-
22
-
23
-
24
-
25
-
26
-
27
-
28
-
29
-
30
-
31
-
32
-
33
-
34
-
35
-
36
-
37
-
38
-
39
-
40
-
41
-
42
-
43
-
44
-
45
-
46
-
47
-
48
-
49
-
50
-
51
-
52
-
53
-
54
-
55
-
56
-
57
-
58
-
59
-
60
-
61
-
62
-
63
-
64
-
65
-
66
-
67
-
68
-
69
-
70
-
71
-
72
-
73
-
74
-
75
-
76
-
77
-
78
-
79
-
80
-
81
-
82
-
83
-
84
-
85
-
86
-
87
-
88
-
89
-
90
-
91
-
92
-
93
-
94
-
95
-
96
-
97
-
98
-
99
-
100
-
101
-
102
-
103
-
104
-
105
-
106
-
107
-
108
-
109
-
110
-
111
-
112
-
113
-
114
-
115
-
116
-
117
-
118
-
119
-
120
-
121
-
122
-
123
-
124
-
125
-
126
-
127
-
128
-
129
-
130
-
131
-
132
-
 133
133 -
 134
134 -
 135
135 -
 136
136 -
 137
137 -
 138
138 -
 139
139 -
 140
140 -
 141
141 -
 142
142 -
 143
143 -
 144
144 -
 145
145 -
 146
146 -
 147
147 -
 148
148 -
 149
149 -
 150
150 -
 151
151 -
 152
152 -
 153
153 -
154
-
155
-
156
-
157
-
158
-
159
-
160
-
161
-
162
-
163
-
164
-
165
-
166
-
167
-
168
-
169
-
170
-
171
-
172
-
173
-
174
-
175
-
176
-
177
-
178
-
179
-
180
 |
 |

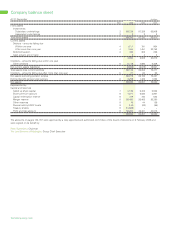
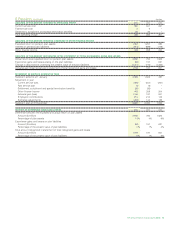
Statistics
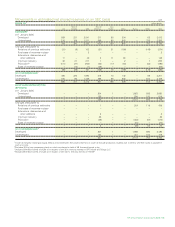
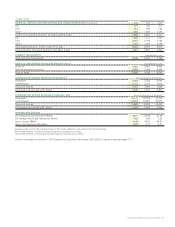
CRUDE OIL, NATURAL GAS AND NATURAL GAS LIQUIDS PRODUCTION (net of royalties) 2005 2004 2003
UK 277 330 377
USA 613 666 726
Other 1,672 1,535 1,018
Crude oil and liquids production (thousand barrels a day) 2,562 2,531 2,121
UK 1,090 1,174 1,446
USA 2,547 2,749 3,128
Other 4,787 4,580 4,039
Natural gas production (million cubic feet a day) 8,424 8,503 8,613
Total production (thousand barrels oil equivalent a day) 4,014 3,997 3,606
REFINERY THROUGHPUTS thousand barrels a day
Group refinery throughputsa2,399 2,607 2,723
CRUDE OIL AND REFINED PETROLEUM PRODUCT SALES thousand barrels a day
Crude oil 2,804 2,691 2,836
Refined petroleum products 5,888 6,398 6,688
Total oil sales 8,692 9,089 9,524
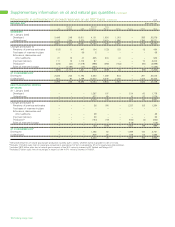
ESTIMATED NET PROVED RESERVES OF CRUDE OILbmillions of barrels at 31 December
Developed 3,060 3,423 3,576
Undeveloped 4,101 4,127 3,873
Group companies 7,161 7,550 7,449
Equity-accounted entities (BP share) 3,246 3,180 2,867
ESTIMATED NET PROVED RESERVES OF NATURAL GAScbillions of cubic feet at 31 December
Developed 18,147 19,372 21,073
Undeveloped 23,819 23,550 22,903
Group companies 41,966 42,922 43,976
Equity-accounted entities (BP share) 3,643 2,628 2,553
AVERAGE REALIZATIONS
BP average liquids realizations ($/bbl) 48.51 35.39 27.25
BP average natural gas realizations ($/mcf) 4.90 3.86 3.39
Brent oil price ($/bbl) 54.48 38.27 28.83
Henry Hub gas price ($/mmBtu) 8.65 6.13 5.37
aIncludes crude oil and other feedstock input to BP’s crude distillation units both for BP and third parties.
bNet proved reserves of crude oil exclude production royalties due to others.
cNet proved reserves of natural gas exclude production royalties due to others.
Further information is included in BP Financial and Operating Information 2001-2005. To obtain a copy see page 177.
BP Annual Report and Accounts 2005 141