BP 2005 Annual Report Download - page 132
Download and view the complete annual report
Please find page 132 of the 2005 BP annual report below. You can navigate through the pages in the report by either clicking on the pages listed below, or by using the keyword search tool below to find specific information within the annual report.-
 1
1 -
2
-
3
-
4
-
5
-
6
-
7
-
8
-
9
-
10
-
11
-
12
-
13
-
14
-
15
-
16
-
17
-
18
-
19
-
20
-
21
-
22
-
23
-
24
-
25
-
26
-
27
-
28
-
29
-
30
-
31
-
32
-
33
-
34
-
35
-
36
-
37
-
38
-
39
-
40
-
41
-
42
-
43
-
44
-
45
-
46
-
47
-
48
-
49
-
50
-
51
-
52
-
53
-
54
-
55
-
56
-
57
-
58
-
59
-
60
-
61
-
62
-
63
-
64
-
65
-
66
-
67
-
68
-
69
-
70
-
71
-
72
-
73
-
74
-
75
-
76
-
77
-
78
-
79
-
80
-
81
-
82
-
83
-
84
-
85
-
86
-
87
-
88
-
89
-
90
-
91
-
92
-
93
-
94
-
95
-
96
-
97
-
98
-
99
-
100
-
101
-
102
-
103
-
104
-
105
-
106
-
107
-
108
-
109
-
110
-
111
-
112
-
113
-
114
-
115
-
116
-
117
-
118
-
119
-
120
-
121
-
 122
122 -
 123
123 -
 124
124 -
 125
125 -
 126
126 -
 127
127 -
 128
128 -
 129
129 -
 130
130 -
 131
131 -
 132
132 -
 133
133 -
 134
134 -
 135
135 -
 136
136 -
 137
137 -
 138
138 -
 139
139 -
 140
140 -
 141
141 -
 142
142 -
143
-
144
-
145
-
146
-
147
-
148
-
149
-
150
-
151
-
152
-
153
-
154
-
155
-
156
-
157
-
158
-
159
-
160
-
161
-
162
-
163
-
164
-
165
-
166
-
167
-
168
-
169
-
170
-
171
-
172
-
173
-
174
-
175
-
176
-
177
-
178
-
179
-
180
 |
 |

130 Making energy more
Notes on financial statements continued
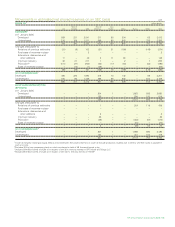
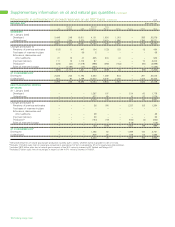
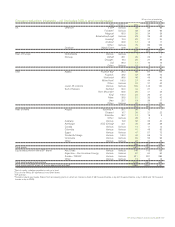
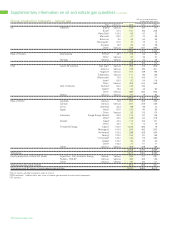
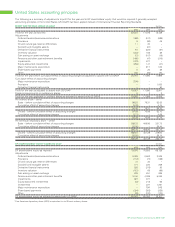
52 Oil and natural gas exploration and production activitiesacontinued
$ million
2003
Rest of Rest of Asia
UK Europe USA Americas Pacific Africa Russia Other Total
CAPITALIZED COSTS
AT 31 DECEMBER
Gross capitalized costs
Proved properties 21,398 4,421 42,960 10,379 3,659 9,856 1 3,295 95,969
Unproved properties 299 230 1,278 713 1,779 563 51 64 4,977
21,697 4,651 44,238 11,092 5,438 10,419 52 3,359 100,946
Accumulated depreciation 13,013 2,886 19,658 5,080 2,413 5,642 33 1,246 49,971
Net capitalized costs 8,684 1,765 24,580 6,012 3,025 4,777 19 2,113 50,975
The group’s share of jointly controlled entities’ and associates’ net capitalized costs at 31 December 2003 was $10,222 million.
COSTS INCURRED FOR THE
YEAR ENDED 31 DECEMBER
Acquisition of properties
Proved – – – – – – – – –
Unproved – – – – – – – – –
– – – – – – – – –
Exploration and appraisal costsb20 69 288 119 57 205 26 40 824
Development costs 740 236 3,476 512 42 1,614 – 917 7,537
Total costs 760 305 3,764 631 99 1,819 26 957 8,361
The group’s share of jointly controlled entities’ and associates’ costs incurred in 2003 was $468 million.
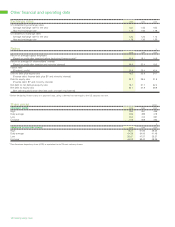
RESULTS OF OPERATIONS FOR THE
YEAR ENDED 31 DECEMBER
Sales and other operating revenuesc
Third parties 2,257 441 1,491 1,233 421 444 – 777 7,064
Sales between businesses 2,901 568 10,991 2,589 925 974 – 1,707 20,655
5,158 1,009 12,482 3,822 1,346 1,418 – 2,484 27,719
Exploration expenditure 17 37 204 164 15 32 21 52 542
Production costs 825 113 1,262 463 166 241 – 135 3,205
Production taxes 233 14 439 189 40 – – 742 1,657
Other costs (income)d(151) 57 2,019 438 160 38 30 946 3,537
Depreciation, depletion and amortization 1,530 167 2,492 531 197 219 – 134 5,270
Impairment and (gains) losses on sale of
businesses and fixed assets (553) 30 573 (387) 347 (122) (65) 2 (175)
1,901 418 6,989 1,398 925 408 (14) 2,011 14,036
Profit before taxatione3,257 591 5,493 2,424 421 1,010 14 473 13,683
Allocable taxes 1,306 305 1,574 847 (52) 438 56 47 4,521
Results of operations 1,951 286 3,919 1,577 473 572 (42) 426 9,162
The group’s share of jointly controlled entities’ and associates’ results of operations in 2003 was a profit of $790 million after deducting interest of
$120 million and taxation of $153 million.
aThis note relates to the requirements contained within the UK Statement of Recommended Practice ‘Accounting for Oil and Gas Exploration, Development, Production
and Decommissioning Activities’. Mid-stream activities of natural gas gathering and distribution and the operation of the main pipelines and tankers are excluded. The
main mid-stream activities are the Alaskan transportation facilities, the Forties Pipeline system and the Central Area Transmission System. The group’s share of jointly
controlled entities’ and associates’ activities is excluded from the tables and included in the footnotes, with the exception of the Abu Dhabi operations, which are
included in the income and expenditure items above.
bIncludes exploration and appraisal drilling expenditures, which are capitalized within intangible fixed assets, and geological and geophysical exploration costs, which are
charged to income as incurred.
cSales and other operating revenues represents proceeds from the sale of production and other crude oil and gas, including royalty oil sold on behalf of others where
royalty is payable in cash.
dIncludes the value of royalty oil sold on behalf of others where royalty is payable in cash, property taxes and other government take.
eThe Exploration and Production profit before interest and tax comprises:
$ million
2003
Exploration and production activities
Group (as above) 13,683
Jointly controlled entities and associates 790
Mid-stream activities 611
Total profit before interest and tax 15,084