BP 2005 Annual Report Download - page 90
Download and view the complete annual report
Please find page 90 of the 2005 BP annual report below. You can navigate through the pages in the report by either clicking on the pages listed below, or by using the keyword search tool below to find specific information within the annual report.-
 1
1 -
2
-
3
-
4
-
5
-
6
-
7
-
8
-
9
-
10
-
11
-
12
-
13
-
14
-
15
-
16
-
17
-
18
-
19
-
20
-
21
-
22
-
23
-
24
-
25
-
26
-
27
-
28
-
29
-
30
-
31
-
32
-
33
-
34
-
35
-
36
-
37
-
38
-
39
-
40
-
41
-
42
-
43
-
44
-
45
-
46
-
47
-
48
-
49
-
50
-
51
-
52
-
53
-
54
-
55
-
56
-
57
-
58
-
59
-
60
-
61
-
62
-
63
-
64
-
65
-
66
-
67
-
68
-
69
-
70
-
71
-
72
-
73
-
74
-
75
-
76
-
77
-
78
-
79
-
 80
80 -
 81
81 -
 82
82 -
 83
83 -
 84
84 -
 85
85 -
 86
86 -
 87
87 -
 88
88 -
 89
89 -
 90
90 -
 91
91 -
 92
92 -
 93
93 -
 94
94 -
 95
95 -
 96
96 -
 97
97 -
 98
98 -
 99
99 -
 100
100 -
101
-
102
-
103
-
104
-
105
-
106
-
107
-
108
-
109
-
110
-
111
-
112
-
113
-
114
-
115
-
116
-
117
-
118
-
119
-
120
-
121
-
122
-
123
-
124
-
125
-
126
-
127
-
128
-
129
-
130
-
131
-
132
-
133
-
134
-
135
-
136
-
137
-
138
-
139
-
140
-
141
-
142
-
143
-
144
-
145
-
146
-
147
-
148
-
149
-
150
-
151
-
152
-
153
-
154
-
155
-
156
-
157
-
158
-
159
-
160
-
161
-
162
-
163
-
164
-
165
-
166
-
167
-
168
-
169
-
170
-
171
-
172
-
173
-
174
-
175
-
176
-
177
-
178
-
179
-
180
 |
 |

88 Making energy more
Notes on financial statements continued
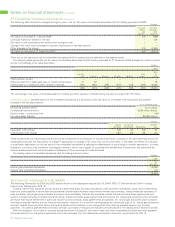
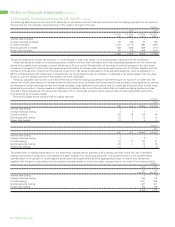
42 Pensions and other post-retirement benefits continued
BP’s post-retirement medical plans in the US provide among other things prescription drug coverage for Medicare-eligible retirees. The group’s
obligation for other post-retirement benefits at 31 December 2004 and 2005 reflects the effects of the Medicare Prescription Drug, Improvement
and Modernization Act of 2003 (the Act). The provisions of the Act provide for a federal subsidy for plans that provide prescription drug benefits and
meet certain qualifications, and alternatively would allow prescription drug plan sponsors to co-ordinate with the Medicare benefit. BP reflected the
impact of the legislation by reducing its actuarially determined obligation for post-retirement benefits at 31 December 2004 and reducing the net cost
for post-retirement benefits in subsequent periods. The reduction in liability was reflected in the 2004 results as an actuarial gain (assumption change).
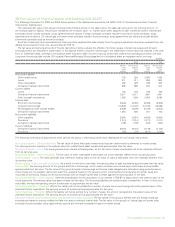
Pension plan assets are generally held in trusts. The primary objective of the trusts is to accumulate pools of assets sufficient to meet the
obligation of the various plans. The assets of the trusts are invested in a manner consistent with fiduciary obligations and principles that reflect
current practices in portfolio management.
A significant proportion of the assets are held in equities, owing to a higher expected level of return over the long term with an acceptable level
of risk. In order to provide reasonable assurance that no single security or type of security has an unwarranted impact on the total portfolio, the
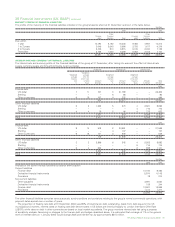
investment portfolios are highly diversified. The long-term asset allocation policy for the major plans is as follows:
Asset category Policy range (%)
Total equity 55-85
Fixed income/cash 15-35
Property/real estate 0-10
Some of the group’s pension funds use derivatives to manage their asset mix and the level of risk. The group’s main pension funds do not directly
invest in either securities or real property of the company or of any affiliate.
Return on asset assumptions reflect the group’s expectations built up by asset class and by country. The group’s expectation is derived from
a combination of historical returns over the long term and the forecasts of market professionals.
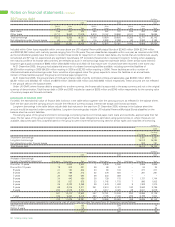
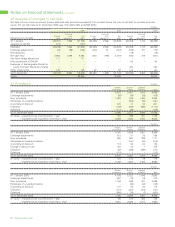
The expected long-term rates of return and market values of the various categories of asset held by the significant defined benefit plans at
31 December are set out below.
2005 2004 2003
Expected Expected Expected
long-term long-term long-term
rate of Market rate of Market rate of Market
return value return value return value
% $ million % $ million % $ million
UK pension plans
Equities 7.50 18,465 7.50 17,329 7.50 14,642
Bonds 4.25 2,719 4.50 2,859 4.75 2,477
Property 6.50 1,097 6.50 1,660 6.50 1,336
Cash 3.50 1,001 4.00 459 4.00 769
7.00 23,282 7.00 22,307 7.00 19,224
US pension plans
Equities 8.50 5,961 8.50 6,043 8.50 5,650
Bonds 4.75 1,079 4.75 1,057 4.75 1,018
Property 8.00 21 8.00 28 8.00 41
Cash 3.00 256 3.00 55 3.50 148
8.00 7,317 8.00 7,183 8.00 6,857
US other post-retirement benefit plans
Equities 8.50 20 8.50 21 8.50 24
Bonds 4.75 8 4.75 9 4.75 9
7.25 28 7.25 30 8.00 33
Other plans
Equities 7.50 991 8.00 933 7.50 686
Bonds 4.00 943 4.25 857 4.75 737
Property 5.75 130 5.25 114 6.50 129
Cash 1.50 216 3.50 288 4.00 187
5.50 2,280 6.00 2,192 6.00 1,739
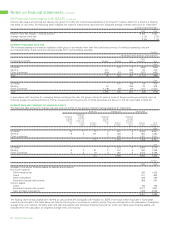
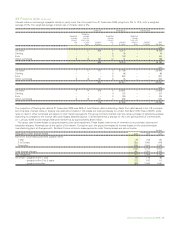
The assumed rate of investment return and discount rate have a significant effect on the amounts reported. A one-percentage-point change
in these assumptions for the group’s plans would have had the following effects:
$ million
One-percentage point
Increase Decrease
Investment return
Effect on pension expense in 2006 (346) 348
Discount rate
Effect on pension expense in 2006 (78) 93
Effect on pension obligation at 31 December 2005 (4,911) 6,379
The assumed US healthcare cost trend rate has a significant effect on the amounts reported. A one-percentage-point change in the assumed US
healthcare cost trend rate would have had the following effects:
$ million
One-percentage point
Increase Decrease
Effect on US post-retirement benefit expense in 2006 32 (26)
Effect on US post-retirement obligation at 31 December 2005 388 (319)