BP 2005 Annual Report Download - page 89
Download and view the complete annual report
Please find page 89 of the 2005 BP annual report below. You can navigate through the pages in the report by either clicking on the pages listed below, or by using the keyword search tool below to find specific information within the annual report.-
 1
1 -
2
-
3
-
4
-
5
-
6
-
7
-
8
-
9
-
10
-
11
-
12
-
13
-
14
-
15
-
16
-
17
-
18
-
19
-
20
-
21
-
22
-
23
-
24
-
25
-
26
-
27
-
28
-
29
-
30
-
31
-
32
-
33
-
34
-
35
-
36
-
37
-
38
-
39
-
40
-
41
-
42
-
43
-
44
-
45
-
46
-
47
-
48
-
49
-
50
-
51
-
52
-
53
-
54
-
55
-
56
-
57
-
58
-
59
-
60
-
61
-
62
-
63
-
64
-
65
-
66
-
67
-
68
-
69
-
70
-
71
-
72
-
73
-
74
-
75
-
76
-
77
-
78
-
 79
79 -
 80
80 -
 81
81 -
 82
82 -
 83
83 -
 84
84 -
 85
85 -
 86
86 -
 87
87 -
 88
88 -
 89
89 -
 90
90 -
 91
91 -
 92
92 -
 93
93 -
 94
94 -
 95
95 -
 96
96 -
 97
97 -
 98
98 -
 99
99 -
100
-
101
-
102
-
103
-
104
-
105
-
106
-
107
-
108
-
109
-
110
-
111
-
112
-
113
-
114
-
115
-
116
-
117
-
118
-
119
-
120
-
121
-
122
-
123
-
124
-
125
-
126
-
127
-
128
-
129
-
130
-
131
-
132
-
133
-
134
-
135
-
136
-
137
-
138
-
139
-
140
-
141
-
142
-
143
-
144
-
145
-
146
-
147
-
148
-
149
-
150
-
151
-
152
-
153
-
154
-
155
-
156
-
157
-
158
-
159
-
160
-
161
-
162
-
163
-
164
-
165
-
166
-
167
-
168
-
169
-
170
-
171
-
172
-
173
-
174
-
175
-
176
-
177
-
178
-
179
-
180
 |
 |

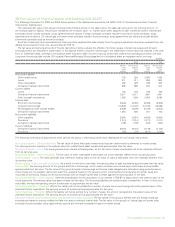
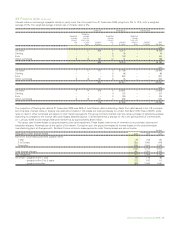
41 Provisions continued
The group makes full provision for the future cost of decommissioning oil and natural gas production facilities and related pipelines on a discounted
basis on the installation of those facilities. At 31 December 2005, the provision for the costs of decommissioning these production facilities and
pipelines at the end of their economic lives was $6,450 million (2004 $5,572 million and 2003 $4,720 million). The provision has been estimated
using existing technology, at current prices and discounted using a real discount rate of 2.0% (2004 2.0% and 2003 2.5%). These costs are
expected to be incurred over the next 30 years. While the provision is based on the best estimate of future costs and the economic lives of the
facilities and pipelines, there is uncertainty regarding both the amount and timing of incurring these costs.
Provisions for environmental remediation are made when a clean-up is probable and the amount reasonably determinable. Generally, this
coincides with commitment to a formal plan of action or, if earlier, on divestment or closure of inactive sites. The provision for environmental
liabilities at 31 December 2005 was $2,311 million (2004 $2,457 million and 2003 $2,298 million). The provision has been estimated using existing
technology, at current prices and discounted using a real discount rate of 2.0% (2004 2.0% and 2003 2.5%). The majority of these costs are
expected to be incurred over the next 10 years. The extent and cost of future remediation programmes are inherently difficult to estimate. They
depend on the scale of any possible contamination, the timing and extent of corrective actions, and also the group’s share of liability.
The group also holds provisions for litigation, expected rental shortfalls on surplus properties, and sundry other liabilities. Included within the new
provisions made for 2005 is an amount of $700 million in respect of the Texas City incident of which $492 million has been disbursed to claimants.
To the extent that these liabilities are not expected to be settled within the next three years, the provisions are discounted using either a nominal
discount rate of 4.5% (2004 4.5% and 2003 4.5%) or a real discount rate of 2.0% (2004 2.0% and 2003 2.5%), as appropriate.
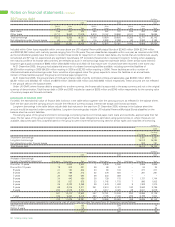
42 Pensions and other post-retirement benefits
Most group companies have pension plans, the forms and benefits of which vary with conditions and practices in the countries concerned. Pension
benefits may be provided through defined contribution plans (money purchase schemes) or defined benefit plans (final salary and other types of
schemes with committed pension payments). For defined contribution plans, retirement benefits are determined by the value of funds arising from
contributions paid in respect of each employee. For defined benefit plans, retirement benefits are based on such factors as the employees’
pensionable salary and length of service. Defined benefit plans may be externally funded or unfunded. The assets of funded plans are generally
held in separately administered trusts.
Contributions to funded defined benefit plans are based on advice from independent actuaries using actuarial methods, the objective of which
is to provide adequate funds to meet pension obligations as they fall due. During 2005, contributions of $340 million (2004 $249 million and 2003
$258 million) and $279 million (2004 $30 million and 2003 $2,189 million) were made to the UK plans and US plans respectively. In addition,
contributions of $140 million (2004 $116 million and 2003 $86 million) were made to other funded defined benefit plans. The aggregate level of
contributions in 2006 is expected to be approximately $750 million.
Certain group companies, principally in the US, provide post-retirement healthcare and life insurance benefits to their retired employees and
dependants. The entitlement to these benefits is usually based on the employee remaining in service until retirement age and completion of a
minimum period of service. The plans are funded to a limited extent.
The cost of providing pensions and other post-retirement benefits is assessed annually by independent actuaries using the projected unit
method. The date of the most recent actuarial review was 31 December 2005.
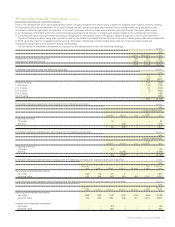
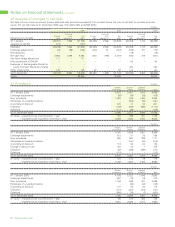
The material financial assumptions used for estimating the benefit obligations of the various plans are set out below. The assumptions used to
evaluate accrued pension and other post-retirement benefits at 31 December in any year are used to determine pension and other post-retirement
expense for the following year, that is, the assumptions at 31 December 2005 are used to determine the pension liabilities at that date and the
pension cost for 2006.
%
UK USA Other
2005 2004 2003 2005 2004 2003 2005 2004 2003
Discount rate for plan liabilities 4.75 5.25 5.5 5.50 5.75 6.0 4.0 5.0 5.5
Rate of increase in salaries 4.25 4.0 4.0 4.25 4.0 4.0 3.25 4.0 4.0
Rate of increase for pensions in
payment 2.5 2.5 2.5 nil nil nil 1.75 2.5 2.5
Rate of increase in deferred pensions 2.5 2.5 2.5 nil nil nil 1.0 2.5 2.5
Inflation 2.5 2.5 2.5 2.50 2.5 2.5 2.0 2.5 2.5
In addition to the financial assumptions, we regularly review the demographic and mortality assumptions. Mortality assumptions reflect best
practice in the countries in which we provide pensions, and have been chosen with regard to the latest available tables adjusted where appropriate
to reflect the experience of the group. BP’s most substantial pension liabilities are in the UK and US, where these tables lead to a further life
expectancy for a male/female currently aged 60 of 23/26 years in the UK and 22/26 years in the US.
Assumed future US healthcare cost trend rate %
2013 and
subsequent
2006 2007 2008 2009 2010 2011 2012 years
Beneficiaries aged under 65 9.0 8.0 7.0 6.0 5.5 5.0 5.0 5.0
Beneficiaries aged over 65 11.0 9.5 8.5 7.5 6.5 6.0 5.5 5.0
BP Annual Report and Accounts 2005 87