BP 2005 Annual Report Download - page 73
Download and view the complete annual report
Please find page 73 of the 2005 BP annual report below. You can navigate through the pages in the report by either clicking on the pages listed below, or by using the keyword search tool below to find specific information within the annual report.-
 1
1 -
2
-
3
-
4
-
5
-
6
-
7
-
8
-
9
-
10
-
11
-
12
-
13
-
14
-
15
-
16
-
17
-
18
-
19
-
20
-
21
-
22
-
23
-
24
-
25
-
26
-
27
-
28
-
29
-
30
-
31
-
32
-
33
-
34
-
35
-
36
-
37
-
38
-
39
-
40
-
41
-
42
-
43
-
44
-
45
-
46
-
47
-
48
-
49
-
50
-
51
-
52
-
53
-
54
-
55
-
56
-
57
-
58
-
59
-
60
-
61
-
62
-
 63
63 -
 64
64 -
 65
65 -
 66
66 -
 67
67 -
 68
68 -
 69
69 -
 70
70 -
 71
71 -
 72
72 -
 73
73 -
 74
74 -
 75
75 -
 76
76 -
 77
77 -
 78
78 -
 79
79 -
 80
80 -
 81
81 -
 82
82 -
 83
83 -
84
-
85
-
86
-
87
-
88
-
89
-
90
-
91
-
92
-
93
-
94
-
95
-
96
-
97
-
98
-
99
-
100
-
101
-
102
-
103
-
104
-
105
-
106
-
107
-
108
-
109
-
110
-
111
-
112
-
113
-
114
-
115
-
116
-
117
-
118
-
119
-
120
-
121
-
122
-
123
-
124
-
125
-
126
-
127
-
128
-
129
-
130
-
131
-
132
-
133
-
134
-
135
-
136
-
137
-
138
-
139
-
140
-
141
-
142
-
143
-
144
-
145
-
146
-
147
-
148
-
149
-
150
-
151
-
152
-
153
-
154
-
155
-
156
-
157
-
158
-
159
-
160
-
161
-
162
-
163
-
164
-
165
-
166
-
167
-
168
-
169
-
170
-
171
-
172
-
173
-
174
-
175
-
176
-
177
-
178
-
179
-
180
 |
 |

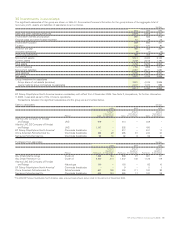
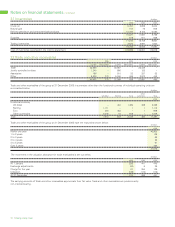
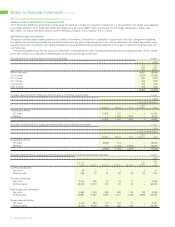
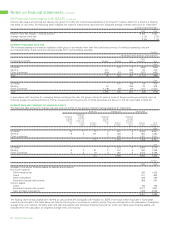
33 Cash and cash equivalents $ million
2005 2004 2003
Cash at bank and in hand 1,594 1,031 1,871
Cash equivalents
Listed 73 63 79
Unlisted 1,293 265 106
Carrying amount at 31 December 2,960 1,359 2,056
For IFRS, cash equivalents are classified as available-for-sale financial assets and as such are recorded at fair value. Prior to 2005, cash equivalents
were stated at cost.
34 Trade and other payables $ million
2005 2004 2003
Non- Non- Non-
Current current Current current Current current
Trade 28,614 – 27,471 – 20,830 –
Jointly controlled entities 251 – 637 – 126 –
Associates 627 – 865 5 322 4
Production and similar taxes 763 1,281 517 1,520 421 1,544
Social security 78 – 122 – 96 –
Other 11,803 654 8,928 2,056 7,945 3,082
42,136 1,935 38,540 3,581 29,740 4,630
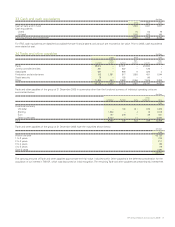
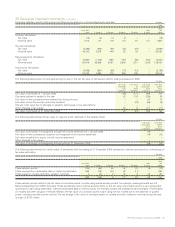
Trade and other payables of the group at 31 December 2005 in currencies other than the functional currency of individual operating units are
summarized below.
$ million
Other
US dollar Sterling Euro currencies Total
2005
Functional currency
US dollar – 133 611 339 1,083
Sterling 1,802 – 4 12 1,818
Euro 157 306 – 38 501
Other currencies 6,640 – 17 – 6,657
To t al 8,599 439 632 389 10,059
Trade and other payables of the group at 31 December 2005 have the maturities shown below.
$ million
2005
Within one year 42,136
1 to 2 years 276
2 to 3 years 211
3 to 4 years 182
4 to 5 years 179
Over 5 years 1,087
44,071
The carrying amounts of Trade and other payables approximate their fair value. Included within Other payables is the deferred consideration for the
acquisition of our interest in TNK-BP, which was discounted on initial recognition. The remaining Trade and other payables are predominantly interest-free.
BP Annual Report and Accounts 2005 71