BP 2005 Annual Report Download - page 153
Download and view the complete annual report
Please find page 153 of the 2005 BP annual report below. You can navigate through the pages in the report by either clicking on the pages listed below, or by using the keyword search tool below to find specific information within the annual report.-
 1
1 -
2
-
3
-
4
-
5
-
6
-
7
-
8
-
9
-
10
-
11
-
12
-
13
-
14
-
15
-
16
-
17
-
18
-
19
-
20
-
21
-
22
-
23
-
24
-
25
-
26
-
27
-
28
-
29
-
30
-
31
-
32
-
33
-
34
-
35
-
36
-
37
-
38
-
39
-
40
-
41
-
42
-
43
-
44
-
45
-
46
-
47
-
48
-
49
-
50
-
51
-
52
-
53
-
54
-
55
-
56
-
57
-
58
-
59
-
60
-
61
-
62
-
63
-
64
-
65
-
66
-
67
-
68
-
69
-
70
-
71
-
72
-
73
-
74
-
75
-
76
-
77
-
78
-
79
-
80
-
81
-
82
-
83
-
84
-
85
-
86
-
87
-
88
-
89
-
90
-
91
-
92
-
93
-
94
-
95
-
96
-
97
-
98
-
99
-
100
-
101
-
102
-
103
-
104
-
105
-
106
-
107
-
108
-
109
-
110
-
111
-
112
-
113
-
114
-
115
-
116
-
117
-
118
-
119
-
120
-
121
-
122
-
123
-
124
-
125
-
126
-
127
-
128
-
129
-
130
-
131
-
132
-
133
-
134
-
135
-
136
-
137
-
138
-
139
-
140
-
141
-
142
-
 143
143 -
 144
144 -
 145
145 -
 146
146 -
 147
147 -
 148
148 -
 149
149 -
 150
150 -
 151
151 -
 152
152 -
 153
153 -
 154
154 -
 155
155 -
 156
156 -
 157
157 -
 158
158 -
 159
159 -
 160
160 -
 161
161 -
 162
162 -
 163
163 -
164
-
165
-
166
-
167
-
168
-
169
-
170
-
171
-
172
-
173
-
174
-
175
-
176
-
177
-
178
-
179
-
180
 |
 |

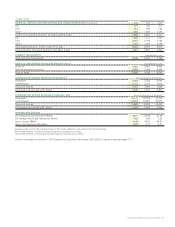
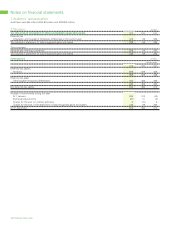
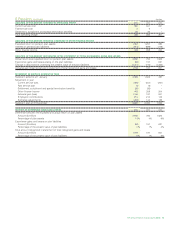
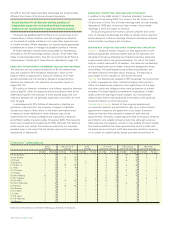
6 Pensions continued $ million
ANALYSIS OF THE AMOUNT CHARGED TO OPERATING PROFIT 2005 2004 2003
Current service cost 360 341 261
Past service cost 4 5 –
Settlement, curtailment and special termination benefits 36 36 –
Total operating charge 400 382 261
ANALYSIS OF THE AMOUNT CREDITED (CHARGED) TO OTHER FINANCE INCOME
Expected return on pension plan assets 1,357 1,257 983
Interest on pension plan liabilities (914) (899) (779)
Other finance income 443 358 204
ANALYSIS OF THE AMOUNT RECOGNIZED IN THE STATEMENT OF TOTAL RECOGNIZED GAINS AND LOSSES
Actual return less expected return on pension plan assets 2,946 750 1,526
Experience gains and losses arising on the plan liabilities (66) 157 621
Change in assumptions underlying the present value of the plan liabilities (1,721) (710) (1,306)
Actuarial gain (loss) recognized in statement of total recognized gains and losses 1,159 197 841
MOVEMENT IN SURPLUS DURING THE YEAR
Surplus in scheme at 1 January 2,093 1,562 497
Movement in year
Current service cost (360) (341) (261)
Past service cost (4) (5) –
Settlement, curtailment and special termination benefits (36) (36) –
Other finance income 443 358 204
Actuarial gain (loss) 1,159 197 841
Employers’ contributions 214 214 142
Exchange adjustments (283) 144 139
Surplus in plan at 31 December 3,226 2,093 1,562
HISTORY OF EXPERIENCE GAINS AND LOSSES 2005 2004 2003
Difference between the expected and actual return on plan assets
Amount ($ million) 2,946 750 1,526
Percentage of plan assets 14%4%9%
Experience gains and losses on plan liabilities
Amount ($ million) (66) 157 621
Percentage of the present value of plan liabilities 0% 1% 4%
Total amount recognized in statement of total recognized gains and losses
Amount ($ million) 1,159 197 841
Percentage of the present value of plan liabilities 6% 1% 5%
BP Annual Report and Accounts 2005 151