BP 2005 Annual Report Download - page 9
Download and view the complete annual report
Please find page 9 of the 2005 BP annual report below. You can navigate through the pages in the report by either clicking on the pages listed below, or by using the keyword search tool below to find specific information within the annual report.-
 1
1 -
 2
2 -
 3
3 -
 4
4 -
 5
5 -
 6
6 -
 7
7 -
 8
8 -
 9
9 -
 10
10 -
 11
11 -
 12
12 -
 13
13 -
 14
14 -
 15
15 -
 16
16 -
 17
17 -
 18
18 -
 19
19 -
 20
20 -
21
-
22
-
23
-
24
-
25
-
26
-
27
-
28
-
29
-
30
-
31
-
32
-
33
-
34
-
35
-
36
-
37
-
38
-
39
-
40
-
41
-
42
-
43
-
44
-
45
-
46
-
47
-
48
-
49
-
50
-
51
-
52
-
53
-
54
-
55
-
56
-
57
-
58
-
59
-
60
-
61
-
62
-
63
-
64
-
65
-
66
-
67
-
68
-
69
-
70
-
71
-
72
-
73
-
74
-
75
-
76
-
77
-
78
-
79
-
80
-
81
-
82
-
83
-
84
-
85
-
86
-
87
-
88
-
89
-
90
-
91
-
92
-
93
-
94
-
95
-
96
-
97
-
98
-
99
-
100
-
101
-
102
-
103
-
104
-
105
-
106
-
107
-
108
-
109
-
110
-
111
-
112
-
113
-
114
-
115
-
116
-
117
-
118
-
119
-
120
-
121
-
122
-
123
-
124
-
125
-
126
-
127
-
128
-
129
-
130
-
131
-
132
-
133
-
134
-
135
-
136
-
137
-
138
-
139
-
140
-
141
-
142
-
143
-
144
-
145
-
146
-
147
-
148
-
149
-
150
-
151
-
152
-
153
-
154
-
155
-
156
-
157
-
158
-
159
-
160
-
161
-
162
-
163
-
164
-
165
-
166
-
167
-
168
-
169
-
170
-
171
-
172
-
173
-
174
-
175
-
176
-
177
-
178
-
179
-
180
 |
 |

BP Annual Report and Accounts 2005 7
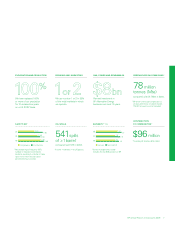
0.41
05 0.62
0.49
04 0.56
0.57
03 0.65
Employees Contractors
SAFETY RIFa
aRecordable Injury Frequency (RIF):
number of reported work-related
incidents resulting in a fatality or injury
(apart from minor first aid cases)
per 200,000 hours worked.
17
05 20
15
04 19
15
03 18
Female Non-UK/US
DIVERSITYa(%)
aSenior management in 2005
includes the top 606 positions in BP.
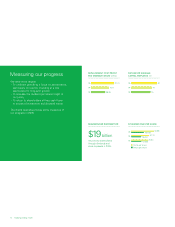
GREENHOUSE GAS EMISSIONSa
78 million
tonnes (Mte)
compared with 81.7Mte in 2004.
aBP share of emissions expressed as
an equivalent mass of carbon dioxide.
TNK-BP emissions are not included.
CONTRIBUTION
TO COMMUNITIESa
$96 million
aIncluding UK charities $0.8 million.
OIL SPILLS
541spills
of >_ 1barrela
compared with 578 in 2004.
a1 barrel = 159 litres = 42 US gallons.
EXPLORATION AND PRODUCTION
We have replaced 100%
or more of our production
for 13 consecutive years
on a UK SORP basis.
GAS, POWER AND RENEWABLES
Planned investment in
BP Alternative Energy
business over next 10 years.
REFINING AND MARKETING
We are number 1 or 2 in 85%
of the retail markets in which
we operate.