BP 2005 Annual Report Download - page 139
Download and view the complete annual report
Please find page 139 of the 2005 BP annual report below. You can navigate through the pages in the report by either clicking on the pages listed below, or by using the keyword search tool below to find specific information within the annual report.-
 1
1 -
2
-
3
-
4
-
5
-
6
-
7
-
8
-
9
-
10
-
11
-
12
-
13
-
14
-
15
-
16
-
17
-
18
-
19
-
20
-
21
-
22
-
23
-
24
-
25
-
26
-
27
-
28
-
29
-
30
-
31
-
32
-
33
-
34
-
35
-
36
-
37
-
38
-
39
-
40
-
41
-
42
-
43
-
44
-
45
-
46
-
47
-
48
-
49
-
50
-
51
-
52
-
53
-
54
-
55
-
56
-
57
-
58
-
59
-
60
-
61
-
62
-
63
-
64
-
65
-
66
-
67
-
68
-
69
-
70
-
71
-
72
-
73
-
74
-
75
-
76
-
77
-
78
-
79
-
80
-
81
-
82
-
83
-
84
-
85
-
86
-
87
-
88
-
89
-
90
-
91
-
92
-
93
-
94
-
95
-
96
-
97
-
98
-
99
-
100
-
101
-
102
-
103
-
104
-
105
-
106
-
107
-
108
-
109
-
110
-
111
-
112
-
113
-
114
-
115
-
116
-
117
-
118
-
119
-
120
-
121
-
122
-
123
-
124
-
125
-
126
-
127
-
128
-
 129
129 -
 130
130 -
 131
131 -
 132
132 -
 133
133 -
 134
134 -
 135
135 -
 136
136 -
 137
137 -
 138
138 -
 139
139 -
 140
140 -
 141
141 -
 142
142 -
 143
143 -
 144
144 -
 145
145 -
 146
146 -
 147
147 -
 148
148 -
 149
149 -
150
-
151
-
152
-
153
-
154
-
155
-
156
-
157
-
158
-
159
-
160
-
161
-
162
-
163
-
164
-
165
-
166
-
167
-
168
-
169
-
170
-
171
-
172
-
173
-
174
-
175
-
176
-
177
-
178
-
179
-
180
 |
 |

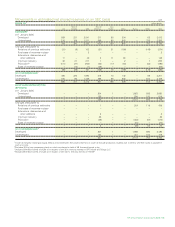
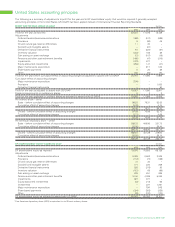
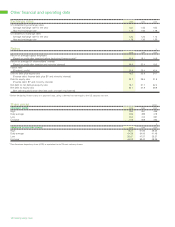
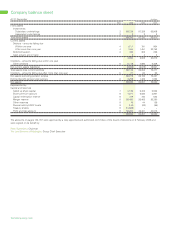
BP net share of production
Group production interests – oil (includes NGLs and condensate) thousand barrels a daya
Field Interest % 2005 2004 2003
UK Offshore ETAPbVarious 49 55 56
FoinavencVarious 39 48 55
Magnusc85.0 30 34 39
Schiehallion/LoyalcVarious 28 39 42
Hardingc70.0 22 27 34
Andrewc62.8 12 12 17
Other Various 75 89 105
Onshore Wytch Farmc67.8 22 26 29
277 330 377
Rest of Europe Netherlands Various Various 1 1 1
Norway Valhallc28.1 25 25 21
Draugen 18.4 20 27 25
Ulac80.0 17 16 16
Other Various 12 8 21
75 77 84
USA Alaska Prudhoe Bayc26.4 89 97 105
Kuparuk 39.2 62 68 73
Northstarc98.6 46 49 46
Milne Pointc100.0 37 44 44
Other Various 34 37 43
Lower 48 onshore Various Various 130 142 160
Gulf of Mexico Na Kikac50.0 44 27 –
Horn Mountainc66.6 26 41 42
Kingc100.0 24 26 31
Mars 28.5 21 35 43
Ursa 22.7 19 29 17
Other Various 80 71 122
612 666 726
Rest of World Angola Kizomba A 26.7 56 16 –
Girassol 16.7 34 31 33
Xikomba 26.7 10 18 2
Other Various 28 6 –
Australia Various 15.8 36 36 40
Azerbaijan ACG (Chirag)c34.1 76 39 38
Canada Various Various 10 11 13
Colombia Various Various 41 48 53
Egypt Various Various 47 57 73
Trinidad & Tobago Various 100.0 40 59 74
Venezuela Various Various 55 55 53
Other Various Various 26 31 49
459 407 428
Total group 1,423 1,480 1,615
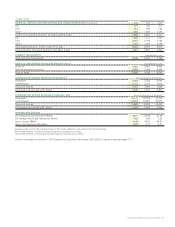
Equity-accounted entities (BP share) Abu Dhabi Various Various 148 142 138
Argentina – Pan American Energy Various Various 67 64 60
Russia – TNK-BP Various Various 911 831 296
Other Various Various 13 14 12
Total equity-accounted entities 1,139 1,051 506
Total group and BP share of equity-accounted entitiesd2,562 2,531 2,121
aNet of royalty, whether payable in cash or in kind.
bOut of nine fields, BP operates six and Shell three.
cBP operator.
dIncludes natural gas liquids (NGLs) from processing plants in which an interest is held of 58 thousand barrels a day (67 thousand barrels a day in 2004 and 70 thousand
barrels a day in 2003).
BP Annual Report and Accounts 2005 137