BP 2005 Annual Report Download - page 171
Download and view the complete annual report
Please find page 171 of the 2005 BP annual report below. You can navigate through the pages in the report by either clicking on the pages listed below, or by using the keyword search tool below to find specific information within the annual report.-
 1
1 -
2
-
3
-
4
-
5
-
6
-
7
-
8
-
9
-
10
-
11
-
12
-
13
-
14
-
15
-
16
-
17
-
18
-
19
-
20
-
21
-
22
-
23
-
24
-
25
-
26
-
27
-
28
-
29
-
30
-
31
-
32
-
33
-
34
-
35
-
36
-
37
-
38
-
39
-
40
-
41
-
42
-
43
-
44
-
45
-
46
-
47
-
48
-
49
-
50
-
51
-
52
-
53
-
54
-
55
-
56
-
57
-
58
-
59
-
60
-
61
-
62
-
63
-
64
-
65
-
66
-
67
-
68
-
69
-
70
-
71
-
72
-
73
-
74
-
75
-
76
-
77
-
78
-
79
-
80
-
81
-
82
-
83
-
84
-
85
-
86
-
87
-
88
-
89
-
90
-
91
-
92
-
93
-
94
-
95
-
96
-
97
-
98
-
99
-
100
-
101
-
102
-
103
-
104
-
105
-
106
-
107
-
108
-
109
-
110
-
111
-
112
-
113
-
114
-
115
-
116
-
117
-
118
-
119
-
120
-
121
-
122
-
123
-
124
-
125
-
126
-
127
-
128
-
129
-
130
-
131
-
132
-
133
-
134
-
135
-
136
-
137
-
138
-
139
-
140
-
141
-
142
-
143
-
144
-
145
-
146
-
147
-
148
-
149
-
150
-
151
-
152
-
153
-
154
-
155
-
156
-
157
-
158
-
159
-
160
-
 161
161 -
 162
162 -
 163
163 -
 164
164 -
 165
165 -
 166
166 -
 167
167 -
 168
168 -
 169
169 -
 170
170 -
 171
171 -
 172
172 -
 173
173 -
 174
174 -
 175
175 -
 176
176 -
 177
177 -
 178
178 -
 179
179 -
 180
180
 |
 |

BP Annual Report and Accounts 2005 169
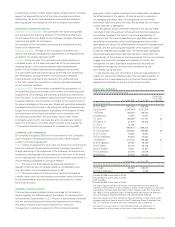
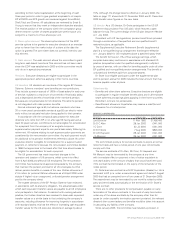
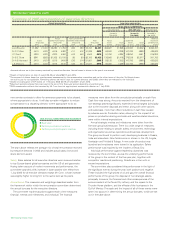
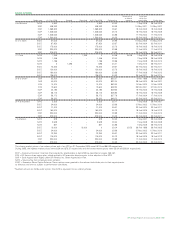
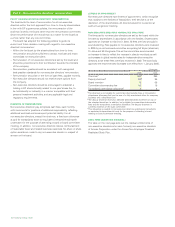
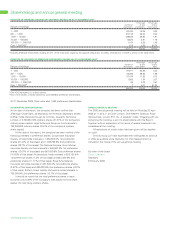
SHARE OPTIONS
Market price Date from
at date of which first
Option type At 1 Jan 2005 Granted Exercised At 31 Dec 2005 Option price exercise exercisable Expiry date
Lord Browne SAYE 4,550 – – 4,550 £3.50 1 Sep 2008 28 Feb 2009
EDIP 408,522 – – 408,522 £5.99 15 May 2001 15 May 2007
EDIP 1,269,843 – – 1,269,843 £5.67 19 Feb 2002 19 Feb 2008
EDIP 1,348,032 – – 1,348,032 £5.72 18 Feb 2003 18 Feb 2009
EDIP 1,348,032 – – 1,348,032 £3.88 17 Feb 2004 17 Feb 2010
EDIP 1,500,000 – – 1,500,000 £4.22 25 Feb 2005 25 Feb 2011
Dr D C Allen EXEC 37,000 – – 37,000 £5.99 15 May 2003 15 May 2010
EXEC 87,950 – – 87,950 £5.67 23 Feb 2004 23 Feb 2011
EXEC 175,000 – – 175,000 £5.72 18 Feb 2005 18 Feb 2012
EDIP 220,000 – – 220,000 £3.88 17 Feb 2004 17 Feb 2010
EDIP 275,000 – – 275,000 £4.22 25 Feb 2005 25 Feb 2011
I C Conn SAYE 1,355 – 1,355 0 £4.98 £6.38 1 Sep 2005 28 Feb 2006
SAYE 1,456 – – 1,456 £3.50 1 Sep 2008 28 Feb 2009
SAYE 1,186 – – 1,186 £3.86 1 Sep 2009 28 Feb 2010
SAYE 0 1,498 – 1498 £4.41 1 Sep 2010 28 Feb 2011
EXEC 72,250 – – 72,250 £5.67 23 Feb 2004 23 Feb 2011
EXEC 130,000 – – 130,000 £5.72 18 Feb 2005 18 Feb 2012
EXEC 160,000 – – 160,000 £3.88 17 Feb 2006 17 Feb 2013
EXEC 126,000 – – 126,000 £4.22 25 Feb 2007 25 Feb 2014
Dr B E GroteaSAR 35,200 – – 35,200 $25.27 6 Mar 1999 6 Mar 2006
SAR 40,000 – – 40,000 $33.34 28 Feb 2000 28 Feb 2007
BPA 10,404 – – 10,404 $53.90 15 Mar 2000 14 Mar 2009
BPA 12,600 – – 12,600 $48.94 28 Mar 2001 27 Mar 2010
EDIP 40,182 – – 40,182 $49.65 19 Feb 2002 19 Feb 2008
EDIP 58,173 – – 58,173 $48.82 18 Feb 2003 18 Feb 2009
EDIP 58,173 – – 58,173 $37.76 17 Feb 2004 17 Feb 2010
EDIP 58,333 – – 58,333 $48.53 25 Feb 2005 25 Feb 2011
Dr A B Hayward SAYE 3,302 – – 3,302 £5.11 1 Sep 2006 28 Feb 2007
EXEC 34,000 – – 34,000 £5.99 15 May 2003 15 May 2010
EXEC 77,400 – – 77,400 £5.67 23 Feb 2004 23 Feb 2011
EXEC 160,000 – – 160,000 £5.72 18 Feb 2005 18 Feb 2012
EDIP 220,000 – – 220,000 £3.88 17 Feb 2004 17 Feb 2010
EDIP 275,000 – – 275,000 £4.22 25 Feb 2005 25 Feb 2011
J A Manzoni SAYE 878 – – 878 £4.52 1 Sep 2007 28 Feb 2008
SAYE 2,548 – – 2,548 £3.50 1 Sep 2008 28 Feb 2009
SAYE 847 – – 847 £3.86 1 Sep 2009 28 Feb 2010
EXEC 12,000 – 12,000 0 £2.04 £5.52 28 Feb 1998 28 Feb 2005
EXEC 34,000 – – 34,000 £5.99 15 May 2003 15 May 2010
EXEC 72,250 – – 72,250 £5.67 23 Feb 2004 23 Feb 2011
EXEC 175,000 – – 175,000 £5.72 18 Feb 2005 18 Feb 2012
EDIP 220,000 – – 220,000 £3.88 17 Feb 2004 17 Feb 2010
EDIP 275,000 – – 275,000 £4.22 25 Feb 2005 25 Feb 2011
The closing market prices of an ordinary share and of an ADS on 31 December 2005 were £6.19 and $64.22 respectively.
During 2005, the highest market prices were £6.84 and $72.27 respectively and the lowest market prices were £5.04 and $56.61 respectively.
EDIP = Executive Directors’ Incentive Plan adopted by shareholders in April 2005 as described on pages 165-167.
BPA = BP Amoco share option plan, which applied to US executive directors prior to the adoption of the EDIP.
SAR = Stock Appreciation Rights under BP America Inc. Share Appreciation Plan.
SAYE = Save As You Earn employee share scheme.
EXEC = Executive Share Option Scheme. These options were granted to the relevant individuals prior to their appointments
as directors and are not subject to performance conditions.
aNumbers shown are ADSs under option. One ADS is equivalent to six ordinary shares.