BP 2005 Annual Report Download - page 134
Download and view the complete annual report
Please find page 134 of the 2005 BP annual report below. You can navigate through the pages in the report by either clicking on the pages listed below, or by using the keyword search tool below to find specific information within the annual report.-
 1
1 -
2
-
3
-
4
-
5
-
6
-
7
-
8
-
9
-
10
-
11
-
12
-
13
-
14
-
15
-
16
-
17
-
18
-
19
-
20
-
21
-
22
-
23
-
24
-
25
-
26
-
27
-
28
-
29
-
30
-
31
-
32
-
33
-
34
-
35
-
36
-
37
-
38
-
39
-
40
-
41
-
42
-
43
-
44
-
45
-
46
-
47
-
48
-
49
-
50
-
51
-
52
-
53
-
54
-
55
-
56
-
57
-
58
-
59
-
60
-
61
-
62
-
63
-
64
-
65
-
66
-
67
-
68
-
69
-
70
-
71
-
72
-
73
-
74
-
75
-
76
-
77
-
78
-
79
-
80
-
81
-
82
-
83
-
84
-
85
-
86
-
87
-
88
-
89
-
90
-
91
-
92
-
93
-
94
-
95
-
96
-
97
-
98
-
99
-
100
-
101
-
102
-
103
-
104
-
105
-
106
-
107
-
108
-
109
-
110
-
111
-
112
-
113
-
114
-
115
-
116
-
117
-
118
-
119
-
120
-
121
-
122
-
123
-
 124
124 -
 125
125 -
 126
126 -
 127
127 -
 128
128 -
 129
129 -
 130
130 -
 131
131 -
 132
132 -
 133
133 -
 134
134 -
 135
135 -
 136
136 -
 137
137 -
 138
138 -
 139
139 -
 140
140 -
 141
141 -
 142
142 -
 143
143 -
 144
144 -
145
-
146
-
147
-
148
-
149
-
150
-
151
-
152
-
153
-
154
-
155
-
156
-
157
-
158
-
159
-
160
-
161
-
162
-
163
-
164
-
165
-
166
-
167
-
168
-
169
-
170
-
171
-
172
-
173
-
174
-
175
-
176
-
177
-
178
-
179
-
180
 |
 |

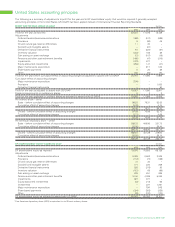
132 Making energy more
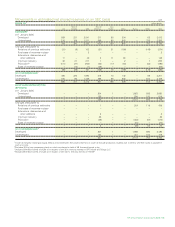
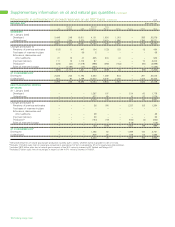
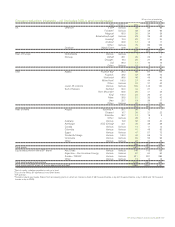
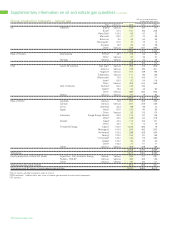
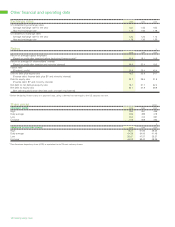
Supplementary information on oil and natural gas quantities continued
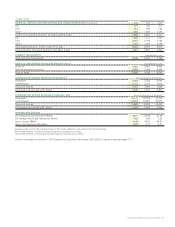
At 31 December 2005, the marker price for Brent crude was $58.21
per barrel and for Henry Hub gas it was $9.52 per mmBtu.
Applying higher year-end prices to reserve estimates and assuming
they apply to the end-of-field life have the effect of increasing proved
reserves associated with concessions (tax and royalty arrangements)
for which additional development opportunities become economic at
higher prices or where higher prices make it more economic to extend
the life of a field. On the other hand, applying higher year-end prices to
reserves in fields subject to PSAs has the effect of decreasing proved
reserves from those fields because higher prices result in lower
volume entitlements.
The company’s proved reserves estimates on an SEC basis for
the year ended 31 December 2005 reflect year-end prices and some
adjustments that have been made vis-à-vis individual asset reserve
estimates based on different applications of certain SEC
interpretations of SEC regulations relating to the use of technology
(mainly seismic) to estimate reserves in the reservoir away from
wellbores and the reporting of fuel gas (i.e. gas used for fuel in
operations on the lease) within proved reserves. On an aggregate
basis, the net impact of these changes, comprising some reductions
and some additions, is a decrease of 378mmboe compared with
our reserves under UK SORP, resulting in total proved reserves of
17,893mmboe (including equity-accounted entities). Excluding
equity-accounted entities, our proved reserves on an SEC basis were
14,023mmboe.
The total net movement in subsidiaries and equity-accounted
entities comprises a decrease of 397mmboe as a result of using the
year-end price, offset by a net increase of 19mmboe in respect of fuel
gas and technology interpretations.
Following SEC rules for reserves, our total proved reserves for
subsidiaries and equity-accounted entities at the end of 2005 were
17,893mmboe, representing a proved reserve replacement ratio (RRR)
before acquisitions and divestments of 95% versus 89% in 2004. For
subsidiaries only, the RRR is 68% and, for equity-accounted entities
only, the RRR is 151%.
The estimated proved oil and natural gas reserves prepared on an
SEC basis are shown on pages 135-136.