BP 2005 Annual Report Download - page 135
Download and view the complete annual report
Please find page 135 of the 2005 BP annual report below. You can navigate through the pages in the report by either clicking on the pages listed below, or by using the keyword search tool below to find specific information within the annual report.-
 1
1 -
2
-
3
-
4
-
5
-
6
-
7
-
8
-
9
-
10
-
11
-
12
-
13
-
14
-
15
-
16
-
17
-
18
-
19
-
20
-
21
-
22
-
23
-
24
-
25
-
26
-
27
-
28
-
29
-
30
-
31
-
32
-
33
-
34
-
35
-
36
-
37
-
38
-
39
-
40
-
41
-
42
-
43
-
44
-
45
-
46
-
47
-
48
-
49
-
50
-
51
-
52
-
53
-
54
-
55
-
56
-
57
-
58
-
59
-
60
-
61
-
62
-
63
-
64
-
65
-
66
-
67
-
68
-
69
-
70
-
71
-
72
-
73
-
74
-
75
-
76
-
77
-
78
-
79
-
80
-
81
-
82
-
83
-
84
-
85
-
86
-
87
-
88
-
89
-
90
-
91
-
92
-
93
-
94
-
95
-
96
-
97
-
98
-
99
-
100
-
101
-
102
-
103
-
104
-
105
-
106
-
107
-
108
-
109
-
110
-
111
-
112
-
113
-
114
-
115
-
116
-
117
-
118
-
119
-
120
-
121
-
122
-
123
-
124
-
 125
125 -
 126
126 -
 127
127 -
 128
128 -
 129
129 -
 130
130 -
 131
131 -
 132
132 -
 133
133 -
 134
134 -
 135
135 -
 136
136 -
 137
137 -
 138
138 -
 139
139 -
 140
140 -
 141
141 -
 142
142 -
 143
143 -
 144
144 -
 145
145 -
146
-
147
-
148
-
149
-
150
-
151
-
152
-
153
-
154
-
155
-
156
-
157
-
158
-
159
-
160
-
161
-
162
-
163
-
164
-
165
-
166
-
167
-
168
-
169
-
170
-
171
-
172
-
173
-
174
-
175
-
176
-
177
-
178
-
179
-
180
 |
 |

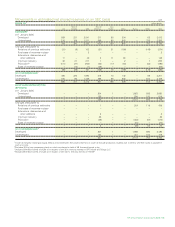
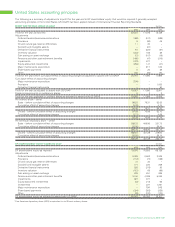
Movements in estimated net proved reserves on a UK SORP basis 2005
CRUDE OILamillion barrels
Rest of Rest of Asia
UK Europe USA Americas Pacific Africa Russia Other Total
SUBSIDIARY
At 1 January 2005
Developed 548 217 1,938 296 70 275 – 79 3,423
Undeveloped 207 109 1,258 300 86 942 – 1,225 4,127
755 326 3,196 596 156 1,217 – 1,304 7,550
Changes attributable to
Revisions of previous estimates (39) (10) 15 (20) 19 (193) – (144) (372)
Purchases of reserves-in-place – – 2 – – – – – 2
Extensions, discoveries and
other additions 11 – 62 3 11 131 – – 218
Improved recovery 33 21 240 1 – 2 – 13 310
Productionb(101) (28) (200) (52) (17) (64) – (34) (496)
Sales of reserves-in-place – (15) (1) (35) – – – – (51)
(96) (32) 118 (103) 13 (124) – (165) (389)
AT 31 DECEMBER 2005c
Developed 475 209 1,801 206 73 202 – 94 3,060
Undeveloped 184 85 1,513 287 96 891 – 1,045 4,101
659 294 3,314 493 169 1,093 – 1,139 7,161
EQUITY-ACCOUNTED ENTITIES
(BP SHARE)
At 1 January 2005
Developed – – – 204 1 – 1,863 593 2,661
Undeveloped – – – 126 – – 294 99 519
– – – 330 1 – 2,157 692 3,180
Changes attributable to
Revisions of previous estimates – – – – – – 368 111 479
Purchases of reserves-in-place – – – – – – – – –
Extensions, discoveries and
other additions – – – 2 – – – – 2
Improved recovery – – – 25 – – – – 25
Production – – – (26) – – (333) (57) (416)
Sales of reserves-in-place – – – – – – (24) – (24)
– – – 1 – – 11 54 66
AT 31 DECEMBER 2005d
Developed – – – 207 1 – 1,682 582 2,472
Undeveloped – – – 124 – – 486 164 774
– – – 331 1 – 2,168 746 3,246
TOTAL GROUP AND BP SHARE
OF EQUITY-ACCOUNTED ENTITIES 659 294 3,314 824 170 1,093 2,168 1,885 10,407
aCrude oil includes natural gas liquids (NGLs) and condensate. Net proved reserves of crude oil exclude production royalties due to others, whether royalty is payable in
cash or in kind.
bExcludes NGLs from processing plants in which an interest is held of 58 thousand barrels a day.
cIncludes 29 million barrels of crude oil in respect of the 30% minority interest in BP Trinidad and Tobago LLC.
dIncludes 97 million barrels of crude oil in respect of the 4.47% minority interest in TNK-BP.
BP Annual Report and Accounts 2005 133