BP 2005 Annual Report Download - page 68
Download and view the complete annual report
Please find page 68 of the 2005 BP annual report below. You can navigate through the pages in the report by either clicking on the pages listed below, or by using the keyword search tool below to find specific information within the annual report.-
 1
1 -
2
-
3
-
4
-
5
-
6
-
7
-
8
-
9
-
10
-
11
-
12
-
13
-
14
-
15
-
16
-
17
-
18
-
19
-
20
-
21
-
22
-
23
-
24
-
25
-
26
-
27
-
28
-
29
-
30
-
31
-
32
-
33
-
34
-
35
-
36
-
37
-
38
-
39
-
40
-
41
-
42
-
43
-
44
-
45
-
46
-
47
-
48
-
49
-
50
-
51
-
52
-
53
-
54
-
55
-
56
-
57
-
 58
58 -
 59
59 -
 60
60 -
 61
61 -
 62
62 -
 63
63 -
 64
64 -
 65
65 -
 66
66 -
 67
67 -
 68
68 -
 69
69 -
 70
70 -
 71
71 -
 72
72 -
 73
73 -
 74
74 -
 75
75 -
 76
76 -
 77
77 -
 78
78 -
79
-
80
-
81
-
82
-
83
-
84
-
85
-
86
-
87
-
88
-
89
-
90
-
91
-
92
-
93
-
94
-
95
-
96
-
97
-
98
-
99
-
100
-
101
-
102
-
103
-
104
-
105
-
106
-
107
-
108
-
109
-
110
-
111
-
112
-
113
-
114
-
115
-
116
-
117
-
118
-
119
-
120
-
121
-
122
-
123
-
124
-
125
-
126
-
127
-
128
-
129
-
130
-
131
-
132
-
133
-
134
-
135
-
136
-
137
-
138
-
139
-
140
-
141
-
142
-
143
-
144
-
145
-
146
-
147
-
148
-
149
-
150
-
151
-
152
-
153
-
154
-
155
-
156
-
157
-
158
-
159
-
160
-
161
-
162
-
163
-
164
-
165
-
166
-
167
-
168
-
169
-
170
-
171
-
172
-
173
-
174
-
175
-
176
-
177
-
178
-
179
-
180
 |
 |

66 Making energy more
Notes on financial statements continued
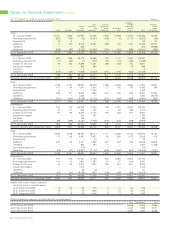
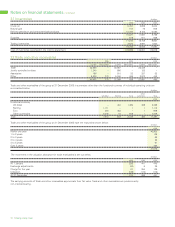
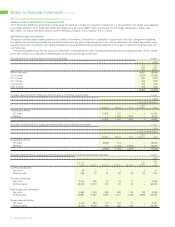
26 Property, plant and equipment $ million
Oil depots,
Plant, Fixtures, storage Of which:
Oil and machinery fittings and tanks and assets
gas and office Transport- service under
Land Buildings properties equipment equipment ation stations Total construction
Cost
At 1 January 2005 5,471 1,965 103,967 42,302 1,694 13,588 14,435 183,422 15,038
Exchange adjustments (387) (136) (15) (2,364) (180) (4) (1,117) (4,203) (66)
Acquisitions 19 3 – – 1 – – 23 27
Additions 41 191 8,773 2,451 383 133 816 12,788 10,467
Transfers – – 325 – – – – 325 (8,668)
Deletions (568) (69) (2,675) (13,609) (784) (451) (885) (19,041) (683)
At 31 December 2005 4,576 1,954 110,375 28,780 1,114 13,266 13,249 173,314 16,115
Depreciation
At 1 January 2005 863 538 54,012 19,556 726 7,141 7,494 90,330
Exchange adjustments (17) (60) (7) (916) (67) (76) (496) (1,639)
Charge for the year 79 143 5,696 1,691 399 309 704 9,021
Impairment losses – – 266 590 – – 42 898
Transfers – – 6 – – – – 6
Deletions (216) (65) (1,819) (7,504) (741) (270) (634) (11,249)
At 31 December 2005 709 556 58,154 13,417 317 7,104 7,110 87,367
Net book amount at 31 December 2005 3,867 1,398 52,221 15,363 797 6,162 6,139 85,947 16,115
Cost
At 1 January 2004 4,799 2,191 96,991 39,840 1,458 13,099 13,529 171,907 13,957
Exchange adjustments 477 68 1,641 1,916 37 182 725 5,046 158
Acquisitions 10 – – 1,453 – – – 1,463 –
Additions 308 121 8,048 1,863 513 672 869 12,394 10,084
Transfers – – 1,036 – – – – 1,036 (8,879)
Deletions (123) (415) (3,749) (2,770) (314) (365) (688) (8,424) (282)
At 31 December 2004 5,471 1,965 103,967 42,302 1,694 13,588 14,435 183,422 15,038
Depreciation
At 1 January 2004 815 700 50,028 17,363 796 7,031 6,567 83,300
Exchange adjustments 87 27 948 1,193 3 83 369 2,710
Charge for the year 50 96 5,203 2,142 197 229 917 8,834
Impairment losses – – 404 761 – – – 1,165
Transfers – – 196 – – – – 196
Deletions (89) (285) (2,767) (1,903) (270) (202) (359) (5,875)
At 31 December 2004 863 538 54,012 19,556 726 7,141 7,494 90,330
Net book amount at 31 December 2004 4,608 1,427 49,955 22,746 968 6,447 6,941 93,092 15,038
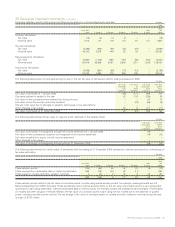
Cost
At 1 January 2003 3,838 2,048 98,250 36,214 1,141 12,398 12,184 166,073 12,127
Exchange adjustments 713 102 2,461 3,831 56 283 1,073 8,519 216
Acquisitions – – – 34 – – – 34 –
Additions 297 113 8,737 1,693 497 672 799 12,808 10,800
Transfers – – 820 184 – – – 1,004 (7,359)
Fair value adjustment – – (76) – – – – (76) –
Deletions (49) (72) (13,201) (2,116) (236) (254) (527) (16,455) (1,827)
At 31 December 2003 4,799 2,191 96,991 39,840 1,458 13,099 13,529 171,907 13,957
Depreciation
At 1 January 2003 677 612 51,731 15,159 620 6,826 5,505 81,130
Exchange adjustments 114 10 1,041 1,383 15 97 430 3,090
Charge for the year 44 112 5,310 1,687 290 244 841 8,528
Impairment losses – – 1,013 – – – – 1,013
Transfers – – 66 (9) – – – 57
Deletions (20) (34) (9,133) (857) (129) (136) (209) (10,518)
At 31 December 2003 815 700 50,028 17,363 796 7,031 6,567 83,300
Net book amount at 31 December 2003 3,984 1,491 46,963 22,477 662 6,068 6,962 88,607 13,957
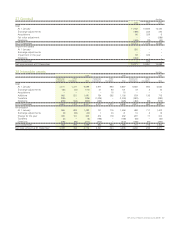
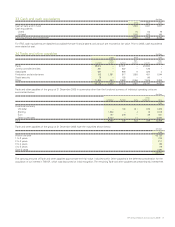
Assets held under finance leases at
net book amount included above
At 31 December 2005 8 24 46 315 2 9 35 439
At 31 December 2004 12 7 45 1,583 7 10 40 1,704
At 31 December 2003 14 8 48 1,648 8 12 44 1,782
Decommissioning asset at net book amount included above
Cost Depreciation Net
At 31 December 2005 5,398 2,342 3,056
At 31 December 2004 4,425 1,908 2,517
At 31 December 2003 3,686 1,606 2,080