BP 2005 Annual Report Download - page 77
Download and view the complete annual report
Please find page 77 of the 2005 BP annual report below. You can navigate through the pages in the report by either clicking on the pages listed below, or by using the keyword search tool below to find specific information within the annual report.-
 1
1 -
2
-
3
-
4
-
5
-
6
-
7
-
8
-
9
-
10
-
11
-
12
-
13
-
14
-
15
-
16
-
17
-
18
-
19
-
20
-
21
-
22
-
23
-
24
-
25
-
26
-
27
-
28
-
29
-
30
-
31
-
32
-
33
-
34
-
35
-
36
-
37
-
38
-
39
-
40
-
41
-
42
-
43
-
44
-
45
-
46
-
47
-
48
-
49
-
50
-
51
-
52
-
53
-
54
-
55
-
56
-
57
-
58
-
59
-
60
-
61
-
62
-
63
-
64
-
65
-
66
-
 67
67 -
 68
68 -
 69
69 -
 70
70 -
 71
71 -
 72
72 -
 73
73 -
 74
74 -
 75
75 -
 76
76 -
 77
77 -
 78
78 -
 79
79 -
 80
80 -
 81
81 -
 82
82 -
 83
83 -
 84
84 -
 85
85 -
 86
86 -
 87
87 -
88
-
89
-
90
-
91
-
92
-
93
-
94
-
95
-
96
-
97
-
98
-
99
-
100
-
101
-
102
-
103
-
104
-
105
-
106
-
107
-
108
-
109
-
110
-
111
-
112
-
113
-
114
-
115
-
116
-
117
-
118
-
119
-
120
-
121
-
122
-
123
-
124
-
125
-
126
-
127
-
128
-
129
-
130
-
131
-
132
-
133
-
134
-
135
-
136
-
137
-
138
-
139
-
140
-
141
-
142
-
143
-
144
-
145
-
146
-
147
-
148
-
149
-
150
-
151
-
152
-
153
-
154
-
155
-
156
-
157
-
158
-
159
-
160
-
161
-
162
-
163
-
164
-
165
-
166
-
167
-
168
-
169
-
170
-
171
-
172
-
173
-
174
-
175
-
176
-
177
-
178
-
179
-
180
 |
 |

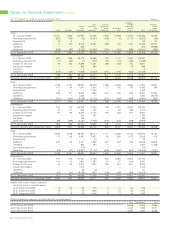
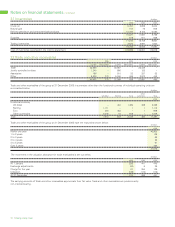
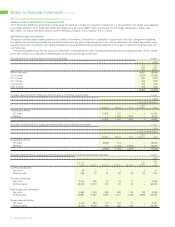
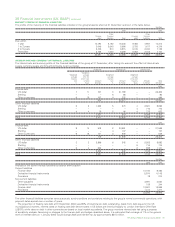
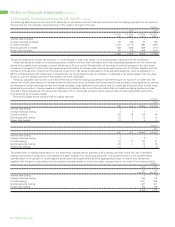
35 Derivative financial instruments continued
Derivative liabilities held for trading have the following contractual or notional values and maturities: $ million
2005
Total
Less than Over fair
1 year 1-2 years 2-3 years 3-4 years 4-5 years 5 years value
Currency derivatives
Fair value (12) (4) (1) (1) – – (18)
Notional value 1,013 177 119 170 67 141 1,687
Oil price derivatives
Fair value (2,486) (275) (26) (20) (19) – (2,826)
Notional value 49,732 2,276 446 35 35 – 52,524
Natural gas price derivatives
Fair value (3,967) (1,319) (591) (187) (89) (154) (6,307)
Notional value 90,916 25,269 6,457 2,903 1,577 1,208 128,330
Power price derivatives
Fair value (2,459) (557) (59) (70) (13) – (3,158)
Notional value 20,030 4,990 778 625 195 – 26,618
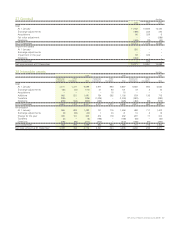
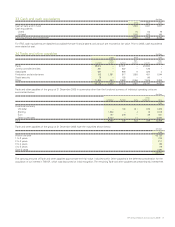
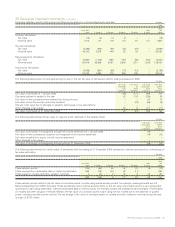
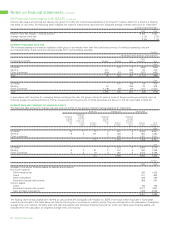
The following tables show the changes during the year in the net fair value of derivatives held for trading purposes for 2005.
$ million
Fair value Fair value Fair value Fair value
exchange oil natural gas power
rate price price price
contracts contracts contracts contracts
Fair value of contracts at 1 January 2005 (54) (171) 558 177
Contracts realized or settled in the year 23 175 (735) 76
Fair value of new contracts when entered into during the year – – 24 10
Fair value of over-the-counter options at inception – (73) (65) (9)
Change in fair value due to changes in valuation techniques or key assumptions ––––
Other changes in fair values 54 8 747 (71)
Fair value of contracts at 31 December 2005 23 (61) 529 183
The following table shows the fair value of ‘day one profit’ deferred on the balance sheet.
$ million
Fair value Fair value
natural gas power
price price
contracts contracts
Fair value of contracts not recognized through the income statement at 1 January 2005 (15) –
Fair value of new contracts at inception not recognized in the income statement (14) (10)
Fair value recycled from equity into the income statement – –
Other changes in fair values – –
Fair value of contracts not recognized through profit at 31 December 2005 (29) (10)
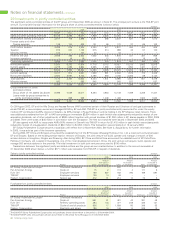
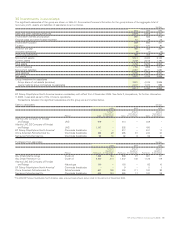
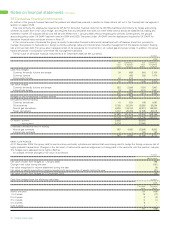
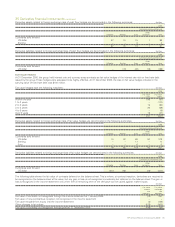
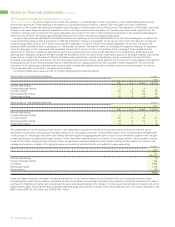
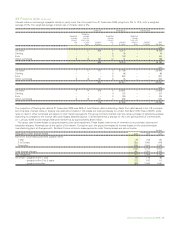
The following table shows the net fair value of derivatives held for trading at 31 December 2005 analysed by maturity period and by methodology of
fair value estimation.
$ million
2005
Total
Less than Over fair
1 year 1-2 years 2-3 years 3-4 years 4-5 years 5 years value
Prices actively quoted (100) (86) 46 42 33 (8) (73)
Prices sourced from observable data or market corroboration 660 (48) (41) 60 (11) – 620
Prices based on models and other valuation methods 3 (2) 3 75 2 46 127
563 (136) 8 177 24 38 674
Prices actively quoted refers to the fair value of contracts valued in whole using prices actively quoted, for example, exchange-traded and UK
National Balancing Point (NBP) contracts. Prices provided by other external sources refers to the fair value of contracts valued in part using active
quotes and in part using observable, market-corroborated data or internal inputs, for example, swaps and physical forward contracts. Prices based
on models and other valuation methods refers to the fair value of a contract valued in part using internal models due to the absence of quoted
prices, including over-the-counter options. The net change in fair value of contracts based on models and other valuation methods during the year
is a gain of $130 million.
BP Annual Report and Accounts 2005 75