BP 2005 Annual Report Download - page 84
Download and view the complete annual report
Please find page 84 of the 2005 BP annual report below. You can navigate through the pages in the report by either clicking on the pages listed below, or by using the keyword search tool below to find specific information within the annual report.-
 1
1 -
2
-
3
-
4
-
5
-
6
-
7
-
8
-
9
-
10
-
11
-
12
-
13
-
14
-
15
-
16
-
17
-
18
-
19
-
20
-
21
-
22
-
23
-
24
-
25
-
26
-
27
-
28
-
29
-
30
-
31
-
32
-
33
-
34
-
35
-
36
-
37
-
38
-
39
-
40
-
41
-
42
-
43
-
44
-
45
-
46
-
47
-
48
-
49
-
50
-
51
-
52
-
53
-
54
-
55
-
56
-
57
-
58
-
59
-
60
-
61
-
62
-
63
-
64
-
65
-
66
-
67
-
68
-
69
-
70
-
71
-
72
-
73
-
 74
74 -
 75
75 -
 76
76 -
 77
77 -
 78
78 -
 79
79 -
 80
80 -
 81
81 -
 82
82 -
 83
83 -
 84
84 -
 85
85 -
 86
86 -
 87
87 -
 88
88 -
 89
89 -
 90
90 -
 91
91 -
 92
92 -
 93
93 -
 94
94 -
95
-
96
-
97
-
98
-
99
-
100
-
101
-
102
-
103
-
104
-
105
-
106
-
107
-
108
-
109
-
110
-
111
-
112
-
113
-
114
-
115
-
116
-
117
-
118
-
119
-
120
-
121
-
122
-
123
-
124
-
125
-
126
-
127
-
128
-
129
-
130
-
131
-
132
-
133
-
134
-
135
-
136
-
137
-
138
-
139
-
140
-
141
-
142
-
143
-
144
-
145
-
146
-
147
-
148
-
149
-
150
-
151
-
152
-
153
-
154
-
155
-
156
-
157
-
158
-
159
-
160
-
161
-
162
-
163
-
164
-
165
-
166
-
167
-
168
-
169
-
170
-
171
-
172
-
173
-
174
-
175
-
176
-
177
-
178
-
179
-
180
 |
 |

82 Making energy more
Notes on financial statements continued
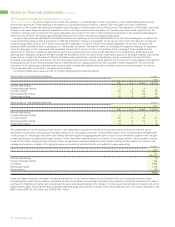
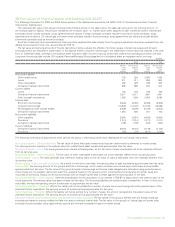
37 Derivative financial instruments (UK GAAP) continued
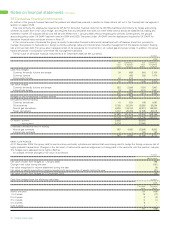
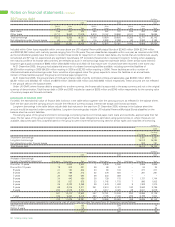
The following table shows the fair value at 31 December of derivatives and other financial instruments held for trading purposes. The fair values at
the year end are not materially unrepresentative of the position throughout the year.
$ million
2004 2003
Fair value Fair value Fair value Fair value
asset liability asset liability
Interest rate contracts – – – –
Foreign exchange contracts 36 (90) 30 (54)
Oil price contracts 1,162 (1,177) 586 (667)
Natural gas price contracts 802 (624) 858 (711)
Power price contracts 82 (12) 548 (514)
2,082 (1,903) 2,022 (1,946)
The group measures its market risk exposure, i.e. potential gain or loss in fair values, on its trading activity using value-at-risk techniques.
These techniques are based on a variance/covariance model or a Monte Carlo simulation and make a statistical assessment of the market risk
arising from possible future changes in market values over a 24-hour period. The calculation of the range of potential changes in fair value takes
into account a snapshot of the end-of-day exposures and the history of one-day price movements over the previous 12 months, together with the
correlation of these price movements. The potential movement in fair values is expressed to three standard deviations, which is equivalent to a
99.7% confidence level. This means that, in broad terms, one would expect to see an increase or a decrease in fair values greater than the value
at risk on only one occasion per year if the portfolio were left unchanged.
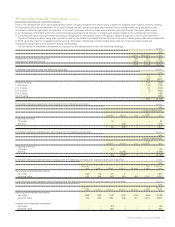
The group calculates value at risk on all instruments that are held for trading purposes and that therefore give an exposure to market risk. The
value-at-risk model takes account of derivative financial instruments such as interest rate forward and futures contracts, swap agreements, options
and swaptions; foreign exchange forward and futures contracts, swap agreements and options; and oil, natural gas and power price futures, swap
agreements and options. Financial assets and liabilities and physical crude oil and refined products that are treated as trading positions are also
included in these calculations. The value-at-risk calculation for oil, natural gas and power price exposure also includes cash-settled commodity
contracts such as forward contracts.
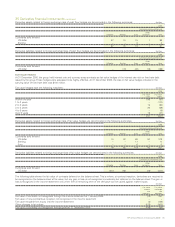
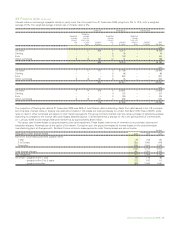
The following table shows values at risk for trading activities.
$ million
2004
High Low Average Year end
Interest rate trading 1 – – –
Foreign exchange trading 4 1 1 1
Oil price trading 55 18 29 45
Natural gas price trading 23 6 13 10
Power price trading 10 1 4 4
$ million
2003
High Low Average Year end
Interest rate trading 1 – – –
Foreign exchange trading 4 – 2 1
Oil price trading 34 17 26 27
Natural gas price trading 29 4 16 18
Power price trading 13 – 4 6
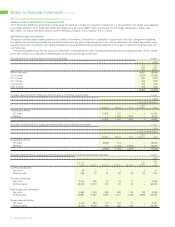
The presentation of trading results shown in the table below includes certain activities of BP’s trading units that involve the use of derivative
financial instruments in conjunction with physical and paper trading of oil, natural gas and power. It is considered that a more comprehensive
representation of the group’s oil, natural gas and power price trading activities is given by aggregating the gain or loss on such derivatives
together with the gain or loss arising from the physical and paper trades to which they relate, representing the net result of the trading portfolio.
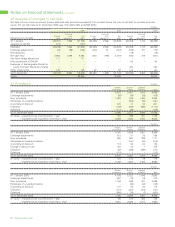
$ million
2004 2003
Net Net
gain (loss) gain (loss)
Interest rate trading 4 9
Foreign exchange trading 136 118
Oil price trading 1,371 825
Natural gas price trading 461 341
Power price trading 160 119
2,132 1,412