HSBC 2005 Annual Report Download - page 91
Download and view the complete annual report
Please find page 91 of the 2005 HSBC annual report below. You can navigate through the pages in the report by either clicking on the pages listed below, or by using the keyword search tool below to find specific information within the annual report.-
 1
1 -
 2
2 -
 3
3 -
 4
4 -
 5
5 -
 6
6 -
 7
7 -
 8
8 -
 9
9 -
 10
10 -
 11
11 -
 12
12 -
 13
13 -
 14
14 -
 15
15 -
 16
16 -
 17
17 -
 18
18 -
 19
19 -
 20
20 -
 21
21 -
 22
22 -
 23
23 -
 24
24 -
 25
25 -
 26
26 -
 27
27 -
 28
28 -
 29
29 -
 30
30 -
 31
31 -
 32
32 -
 33
33 -
 34
34 -
 35
35 -
 36
36 -
 37
37 -
 38
38 -
 39
39 -
 40
40 -
 41
41 -
 42
42 -
 43
43 -
 44
44 -
 45
45 -
 46
46 -
 47
47 -
 48
48 -
 49
49 -
 50
50 -
 51
51 -
 52
52 -
 53
53 -
 54
54 -
 55
55 -
 56
56 -
 57
57 -
 58
58 -
 59
59 -
 60
60 -
 61
61 -
 62
62 -
 63
63 -
 64
64 -
 65
65 -
 66
66 -
 67
67 -
 68
68 -
 69
69 -
 70
70 -
 71
71 -
 72
72 -
 73
73 -
 74
74 -
 75
75 -
 76
76 -
 77
77 -
 78
78 -
 79
79 -
 80
80 -
 81
81 -
 82
82 -
 83
83 -
 84
84 -
 85
85 -
 86
86 -
 87
87 -
 88
88 -
 89
89 -
 90
90 -
 91
91 -
 92
92 -
 93
93 -
 94
94 -
 95
95 -
 96
96 -
 97
97 -
 98
98 -
 99
99 -
 100
100 -
 101
101 -
 102
102 -
 103
103 -
 104
104 -
 105
105 -
 106
106 -
 107
107 -
 108
108 -
 109
109 -
 110
110 -
 111
111 -
 112
112 -
 113
113 -
 114
114 -
 115
115 -
 116
116 -
 117
117 -
 118
118 -
 119
119 -
 120
120 -
 121
121 -
 122
122 -
 123
123 -
 124
124 -
 125
125 -
 126
126 -
 127
127 -
 128
128 -
 129
129 -
 130
130 -
 131
131 -
 132
132 -
 133
133 -
 134
134 -
 135
135 -
 136
136 -
 137
137 -
 138
138 -
 139
139 -
 140
140 -
 141
141 -
 142
142 -
 143
143 -
 144
144 -
 145
145 -
 146
146 -
 147
147 -
 148
148 -
 149
149 -
 150
150 -
 151
151 -
 152
152 -
 153
153 -
 154
154 -
 155
155 -
 156
156 -
 157
157 -
 158
158 -
 159
159 -
 160
160 -
 161
161 -
 162
162 -
 163
163 -
 164
164 -
 165
165 -
 166
166 -
 167
167 -
 168
168 -
 169
169 -
 170
170 -
 171
171 -
 172
172 -
 173
173 -
 174
174 -
 175
175 -
 176
176 -
 177
177 -
 178
178 -
 179
179 -
 180
180 -
 181
181 -
 182
182 -
 183
183 -
 184
184 -
 185
185 -
 186
186 -
 187
187 -
 188
188 -
 189
189 -
 190
190 -
 191
191 -
 192
192 -
 193
193 -
 194
194 -
 195
195 -
 196
196 -
 197
197 -
 198
198 -
 199
199 -
 200
200 -
 201
201 -
 202
202 -
 203
203 -
 204
204 -
 205
205 -
 206
206 -
 207
207 -
 208
208 -
 209
209 -
 210
210 -
 211
211 -
 212
212 -
 213
213 -
 214
214 -
 215
215 -
 216
216 -
 217
217 -
 218
218 -
 219
219 -
 220
220 -
 221
221 -
 222
222 -
 223
223 -
 224
224 -
 225
225 -
 226
226 -
 227
227 -
 228
228 -
 229
229 -
 230
230 -
 231
231 -
 232
232 -
 233
233 -
 234
234 -
 235
235 -
 236
236 -
 237
237 -
 238
238 -
 239
239 -
 240
240 -
 241
241 -
 242
242 -
 243
243 -
 244
244 -
 245
245 -
 246
246 -
 247
247 -
 248
248 -
 249
249 -
 250
250 -
 251
251 -
 252
252 -
 253
253 -
 254
254 -
 255
255 -
 256
256 -
 257
257 -
 258
258 -
 259
259 -
 260
260 -
 261
261 -
 262
262 -
 263
263 -
 264
264 -
 265
265 -
 266
266 -
 267
267 -
 268
268 -
 269
269 -
 270
270 -
 271
271 -
 272
272 -
 273
273 -
 274
274 -
 275
275 -
 276
276 -
 277
277 -
 278
278 -
 279
279 -
 280
280 -
 281
281 -
 282
282 -
 283
283 -
 284
284 -
 285
285 -
 286
286 -
 287
287 -
 288
288 -
 289
289 -
 290
290 -
 291
291 -
 292
292 -
 293
293 -
 294
294 -
 295
295 -
 296
296 -
 297
297 -
 298
298 -
 299
299 -
 300
300 -
 301
301 -
 302
302 -
 303
303 -
 304
304 -
 305
305 -
 306
306 -
 307
307 -
 308
308 -
 309
309 -
 310
310 -
 311
311 -
 312
312 -
 313
313 -
 314
314 -
 315
315 -
 316
316 -
 317
317 -
 318
318 -
 319
319 -
 320
320 -
 321
321 -
 322
322 -
 323
323 -
 324
324 -
 325
325 -
 326
326 -
 327
327 -
 328
328 -
 329
329 -
 330
330 -
 331
331 -
 332
332 -
 333
333 -
 334
334 -
 335
335 -
 336
336 -
 337
337 -
 338
338 -
 339
339 -
 340
340 -
 341
341 -
 342
342 -
 343
343 -
 344
344 -
 345
345 -
 346
346 -
 347
347 -
 348
348 -
 349
349 -
 350
350 -
 351
351 -
 352
352 -
 353
353 -
 354
354 -
 355
355 -
 356
356 -
 357
357 -
 358
358 -
 359
359 -
 360
360 -
 361
361 -
 362
362 -
 363
363 -
 364
364 -
 365
365 -
 366
366 -
 367
367 -
 368
368 -
 369
369 -
 370
370 -
 371
371 -
 372
372 -
 373
373 -
 374
374 -
 375
375 -
 376
376 -
 377
377 -
 378
378 -
 379
379 -
 380
380 -
 381
381 -
 382
382 -
 383
383 -
 384
384 -
 385
385 -
 386
386 -
 387
387 -
 388
388 -
 389
389 -
 390
390 -
 391
391 -
 392
392 -
 393
393 -
 394
394 -
 395
395 -
 396
396 -
 397
397 -
 398
398 -
 399
399 -
 400
400 -
 401
401 -
 402
402 -
 403
403 -
 404
404 -
 405
405 -
 406
406 -
 407
407 -
 408
408 -
 409
409 -
 410
410 -
 411
411 -
 412
412 -
 413
413 -
 414
414 -
 415
415 -
 416
416 -
 417
417 -
 418
418 -
 419
419 -
 420
420 -
 421
421 -
 422
422 -
 423
423 -
 424
424
 |
 |
89
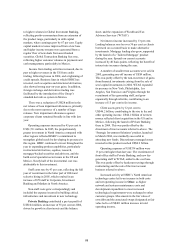
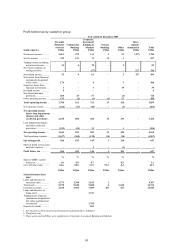
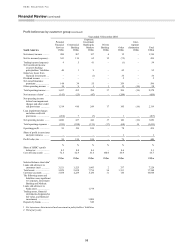
to higher volumes in Global Investment Banking,
reflecting positive momentum from an extension of
the product range, particularly in debt capital
markets, where earnings grew by 67 per cent. Equity
capital markets revenue improved from a low base
and higher income streams were generated from a
regular flow of new deals from asset-backed
securities. Global Transaction Banking fees rose,
reflecting higher customer volumes in payments and
cash management, particularly in Mexico.
Income from trading activities increased, due in
part to higher revenues in the US from credit
trading, following losses in 2004, and a tightening of
credit spreads. Business lines in which HSBC has
invested, such as equities and structured derivatives,
also showed strong year-on-year gains. In addition,
foreign exchange and derivatives trading was
facilitated by the introduction of the Group’s
standard derivatives system in Mexico.
There was a reduction of US$28 million in the
net release of loan impairment allowances, primarily
due to the non-recurrence of a number of large
releases. New impairment allowances against
corporate clients remained broadly in line with last
year.
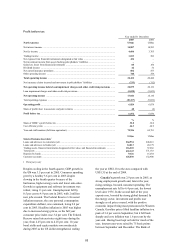
Operating expenses increased by 45 per cent to
US$1,511 million. In 2005, the proportionately
greater investment in North America compared with
other regions reflected HSBC’s commitment to
strengthen global reach by developing its presence in
this region. HSBC continued to invest throughout the
year in expanding product capabilities, particularly
in structured derivatives, equities, research,
mortgage-backed securities and advisory, and the
build out of specialist sector teams in the US and
Mexico. Nearly half of the incremental cost was
attributable to this investment.
Staff costs rose by 43 per cent, reflecting the full
year of recruitment in the latter part of 2004 and
selective hiring in 2005, which resulted in an
increase of 870 staff in Corporate, Investment
Banking and Markets in North America.
Non-staff costs grew correspondingly and
included the expense incurred in building critical
infrastructure and investment in new technology.
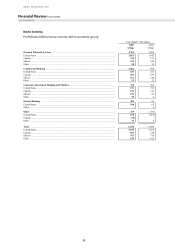
Private Banking contributed a pre-tax profit of
US$104 million, an increase of 55 per cent on 2004,
driven by growth in client assets and the balance
sheet, and the expansion of Wealth and Tax
Advisory Services (‘WTAS’).
Net interest income increased by 13 per cent.
Lending balances rose by over 30 per cent as clients
borrowed on a secured basis to make alternative
investments. Mortgage lending also grew, supported
by the launch of a ‘Tailored Mortgage’ product
during the year. Spreads on current accounts
increased by 40 basis points, reflecting the benefit of
interest rate increases during the year.
A number of smaller trust accounts were sold in
2005, generating one-off income of US$9 million.
This was partly offset by the non-recurrence of gains
from financial investments arising from the sale of
seed capital investments in 2004. WTAS expanded
its presence in New York, Philadelphia, Los
Angeles, San Francisco and Virginia through the
recruitment of fee-generating staff, and grew
organically through referrals, contributing to an
increase of 15 per cent in fee income.
Client assets grew by 12 per cent to
US$46.2 billion, contributing to the rise in fee and
other operating income. US$4.2 billion of net new
money reflected client acquisition in the US and in
Mexico, following the launch of Private Banking
there in 2004. This was partly offset by the
divestment of trust accounts referred to above. The
‘Strategic Investment Solutions’ product, launched
in March 2004, was markedly successful in
attracting new funds. Discretionary managed assets
invested in this product reached US$0.9 billion.
Operating expenses of US$334 million were
13 per cent higher than last year. The recruitment of
front office staff in Private Banking, and new fee-
generating staff in WTAS, added to the cost base.
This was partly offset by headcount savings through
restructuring and the sale of the trust account
business referred to above.
Increased activity at HSBC’s North American
technology centre led to an increase in both costs
and net operating income in Other, as higher
network and systems maintenance costs and
development expenditure to meet increased
technological requirements were recharged to other
customer groups. Movements in the fair value of
own debt and the associated swaps designated at fair
value led to a US$401 million increase in total
operating income.
