HSBC 2005 Annual Report Download - page 287
Download and view the complete annual report
Please find page 287 of the 2005 HSBC annual report below. You can navigate through the pages in the report by either clicking on the pages listed below, or by using the keyword search tool below to find specific information within the annual report.-
 1
1 -
2
-
3
-
4
-
5
-
6
-
7
-
8
-
9
-
10
-
11
-
12
-
13
-
14
-
15
-
16
-
17
-
18
-
19
-
20
-
21
-
22
-
23
-
24
-
25
-
26
-
27
-
28
-
29
-
30
-
31
-
32
-
33
-
34
-
35
-
36
-
37
-
38
-
39
-
40
-
41
-
42
-
43
-
44
-
45
-
46
-
47
-
48
-
49
-
50
-
51
-
52
-
53
-
54
-
55
-
56
-
57
-
58
-
59
-
60
-
61
-
62
-
63
-
64
-
65
-
66
-
67
-
68
-
69
-
70
-
71
-
72
-
73
-
74
-
75
-
76
-
77
-
78
-
79
-
80
-
81
-
82
-
83
-
84
-
85
-
86
-
87
-
88
-
89
-
90
-
91
-
92
-
93
-
94
-
95
-
96
-
97
-
98
-
99
-
100
-
101
-
102
-
103
-
104
-
105
-
106
-
107
-
108
-
109
-
110
-
111
-
112
-
113
-
114
-
115
-
116
-
117
-
118
-
119
-
120
-
121
-
122
-
123
-
124
-
125
-
126
-
127
-
128
-
129
-
130
-
131
-
132
-
133
-
134
-
135
-
136
-
137
-
138
-
139
-
140
-
141
-
142
-
143
-
144
-
145
-
146
-
147
-
148
-
149
-
150
-
151
-
152
-
153
-
154
-
155
-
156
-
157
-
158
-
159
-
160
-
161
-
162
-
163
-
164
-
165
-
166
-
167
-
168
-
169
-
170
-
171
-
172
-
173
-
174
-
175
-
176
-
177
-
178
-
179
-
180
-
181
-
182
-
183
-
184
-
185
-
186
-
187
-
188
-
189
-
190
-
191
-
192
-
193
-
194
-
195
-
196
-
197
-
198
-
199
-
200
-
201
-
202
-
203
-
204
-
205
-
206
-
207
-
208
-
209
-
210
-
211
-
212
-
213
-
214
-
215
-
216
-
217
-
218
-
219
-
220
-
221
-
222
-
223
-
224
-
225
-
226
-
227
-
228
-
229
-
230
-
231
-
232
-
233
-
234
-
235
-
236
-
237
-
238
-
239
-
240
-
241
-
242
-
243
-
244
-
245
-
246
-
247
-
248
-
249
-
250
-
251
-
252
-
253
-
254
-
255
-
256
-
257
-
258
-
259
-
260
-
261
-
262
-
263
-
264
-
265
-
266
-
267
-
268
-
269
-
270
-
271
-
272
-
273
-
274
-
275
-
276
-
 277
277 -
 278
278 -
 279
279 -
 280
280 -
 281
281 -
 282
282 -
 283
283 -
 284
284 -
 285
285 -
 286
286 -
 287
287 -
 288
288 -
 289
289 -
 290
290 -
 291
291 -
 292
292 -
 293
293 -
 294
294 -
 295
295 -
 296
296 -
 297
297 -
298
-
299
-
300
-
301
-
302
-
303
-
304
-
305
-
306
-
307
-
308
-
309
-
310
-
311
-
312
-
313
-
314
-
315
-
316
-
317
-
318
-
319
-
320
-
321
-
322
-
323
-
324
-
325
-
326
-
327
-
328
-
329
-
330
-
331
-
332
-
333
-
334
-
335
-
336
-
337
-
338
-
339
-
340
-
341
-
342
-
343
-
344
-
345
-
346
-
347
-
348
-
349
-
350
-
351
-
352
-
353
-
354
-
355
-
356
-
357
-
358
-
359
-
360
-
361
-
362
-
363
-
364
-
365
-
366
-
367
-
368
-
369
-
370
-
371
-
372
-
373
-
374
-
375
-
376
-
377
-
378
-
379
-
380
-
381
-
382
-
383
-
384
-
385
-
386
-
387
-
388
-
389
-
390
-
391
-
392
-
393
-
394
-
395
-
396
-
397
-
398
-
399
-
400
-
401
-
402
-
403
-
404
-
405
-
406
-
407
-
408
-
409
-
410
-
411
-
412
-
413
-
414
-
415
-
416
-
417
-
418
-
419
-
420
-
421
-
422
-
423
-
424
 |
 |

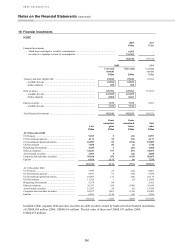
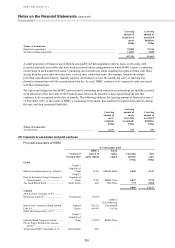
285
Treasury
and other
eligible bills
Debt
securities
Equity
securities Total
US$m US$m US$m US$m
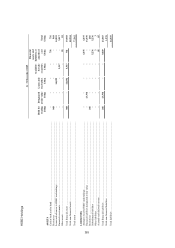
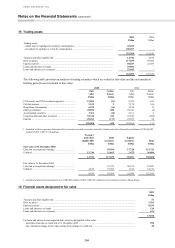
Fair value at 31 December 2005
Listed on a recognised exchange1 ................................ – 3,012 7,192 10,204
Unlisted ....................................................................... 53 2,693 1,341 4,087
53 5,705 8,533 14,291
1Included within listed investments are US$932 million of investments listed in Hong Kong.
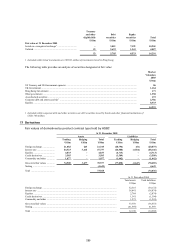
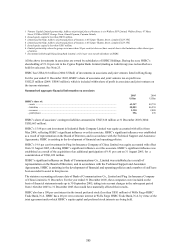
The following table provides an analysis of securities designated at fair value:
Market
Valuation
2005
US$m
US Treasury and US Government agencies ..................................................................................................................... 86
UK Government ............................................................................................................................................................... 1,164
Hong Kong Government .................................................................................................................................................. 171
Other government ............................................................................................................................................................ 1,358
Asset-backed securities .................................................................................................................................................... 193
Corporate debt and other securities1 ................................................................................................................................ 2,786
Equities ............................................................................................................................................................................ 8,533
14,291
1Included within corporate debt and other securities are debt securities issued by banks and other financial institutions of
US$1,703 million.
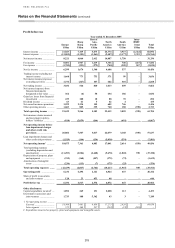
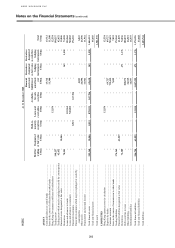
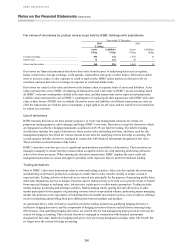
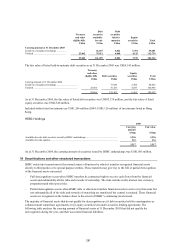
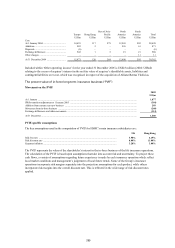
17 Derivatives
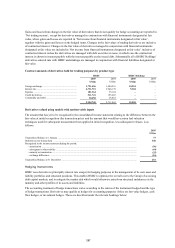
Fair values of derivatives by product contract type held by HSBC
At 31 December 2005
Assets Liabilities
Trading Hedging Total Trading Hedging Total
US$m US$m US$m US$m US$m US$m
Foreign exchange .................... 21,082 263 21,345 (20,794) (81) (20,875)
Interest rate ............................. 44,323 3,414 47,737 (46,580) (1,566) (48,146)
Equities ................................... 4,833 – 4,833 (4,713) – (4,713)
Credit derivatives .................... 3,585 – 3,585 (3,509) – (3,509)
Commodity and other ............. 1,077 – 1,077 (1,442) – (1,442)
Gross total fair values ............. 74,900 3,677 78,577 (77,038) (1,647) (78,685)
Netting .................................... (4,649) 4,649
Total ....................................... 73,928 (74,036)
At 31 December 2004
Total assets Total liabilities
US$m US$m
Foreign exchange ........................................................................................................................... 32,318 (34,172)
Interest rate .................................................................................................................................... 36,041 (36,874)
Equities .......................................................................................................................................... 2,784 (2,874)
Credit derivatives ........................................................................................................................... 1,341 (1,394)
Commodity and other .................................................................................................................... 1,275 (1,243)
Gross total fair values .................................................................................................................... 73,759 (76,557)
Netting ........................................................................................................................................... (41,569) 41,569
Total .............................................................................................................................................. 32,190 (34,988)