HSBC 2005 Annual Report Download - page 225
Download and view the complete annual report
Please find page 225 of the 2005 HSBC annual report below. You can navigate through the pages in the report by either clicking on the pages listed below, or by using the keyword search tool below to find specific information within the annual report.-
 1
1 -
2
-
3
-
4
-
5
-
6
-
7
-
8
-
9
-
10
-
11
-
12
-
13
-
14
-
15
-
16
-
17
-
18
-
19
-
20
-
21
-
22
-
23
-
24
-
25
-
26
-
27
-
28
-
29
-
30
-
31
-
32
-
33
-
34
-
35
-
36
-
37
-
38
-
39
-
40
-
41
-
42
-
43
-
44
-
45
-
46
-
47
-
48
-
49
-
50
-
51
-
52
-
53
-
54
-
55
-
56
-
57
-
58
-
59
-
60
-
61
-
62
-
63
-
64
-
65
-
66
-
67
-
68
-
69
-
70
-
71
-
72
-
73
-
74
-
75
-
76
-
77
-
78
-
79
-
80
-
81
-
82
-
83
-
84
-
85
-
86
-
87
-
88
-
89
-
90
-
91
-
92
-
93
-
94
-
95
-
96
-
97
-
98
-
99
-
100
-
101
-
102
-
103
-
104
-
105
-
106
-
107
-
108
-
109
-
110
-
111
-
112
-
113
-
114
-
115
-
116
-
117
-
118
-
119
-
120
-
121
-
122
-
123
-
124
-
125
-
126
-
127
-
128
-
129
-
130
-
131
-
132
-
133
-
134
-
135
-
136
-
137
-
138
-
139
-
140
-
141
-
142
-
143
-
144
-
145
-
146
-
147
-
148
-
149
-
150
-
151
-
152
-
153
-
154
-
155
-
156
-
157
-
158
-
159
-
160
-
161
-
162
-
163
-
164
-
165
-
166
-
167
-
168
-
169
-
170
-
171
-
172
-
173
-
174
-
175
-
176
-
177
-
178
-
179
-
180
-
181
-
182
-
183
-
184
-
185
-
186
-
187
-
188
-
189
-
190
-
191
-
192
-
193
-
194
-
195
-
196
-
197
-
198
-
199
-
200
-
201
-
202
-
203
-
204
-
205
-
206
-
207
-
208
-
209
-
210
-
211
-
212
-
213
-
214
-
 215
215 -
 216
216 -
 217
217 -
 218
218 -
 219
219 -
 220
220 -
 221
221 -
 222
222 -
 223
223 -
 224
224 -
 225
225 -
 226
226 -
 227
227 -
 228
228 -
 229
229 -
 230
230 -
 231
231 -
 232
232 -
 233
233 -
 234
234 -
 235
235 -
236
-
237
-
238
-
239
-
240
-
241
-
242
-
243
-
244
-
245
-
246
-
247
-
248
-
249
-
250
-
251
-
252
-
253
-
254
-
255
-
256
-
257
-
258
-
259
-
260
-
261
-
262
-
263
-
264
-
265
-
266
-
267
-
268
-
269
-
270
-
271
-
272
-
273
-
274
-
275
-
276
-
277
-
278
-
279
-
280
-
281
-
282
-
283
-
284
-
285
-
286
-
287
-
288
-
289
-
290
-
291
-
292
-
293
-
294
-
295
-
296
-
297
-
298
-
299
-
300
-
301
-
302
-
303
-
304
-
305
-
306
-
307
-
308
-
309
-
310
-
311
-
312
-
313
-
314
-
315
-
316
-
317
-
318
-
319
-
320
-
321
-
322
-
323
-
324
-
325
-
326
-
327
-
328
-
329
-
330
-
331
-
332
-
333
-
334
-
335
-
336
-
337
-
338
-
339
-
340
-
341
-
342
-
343
-
344
-
345
-
346
-
347
-
348
-
349
-
350
-
351
-
352
-
353
-
354
-
355
-
356
-
357
-
358
-
359
-
360
-
361
-
362
-
363
-
364
-
365
-
366
-
367
-
368
-
369
-
370
-
371
-
372
-
373
-
374
-
375
-
376
-
377
-
378
-
379
-
380
-
381
-
382
-
383
-
384
-
385
-
386
-
387
-
388
-
389
-
390
-
391
-
392
-
393
-
394
-
395
-
396
-
397
-
398
-
399
-
400
-
401
-
402
-
403
-
404
-
405
-
406
-
407
-
408
-
409
-
410
-
411
-
412
-
413
-
414
-
415
-
416
-
417
-
418
-
419
-
420
-
421
-
422
-
423
-
424
 |
 |
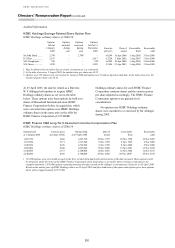
223
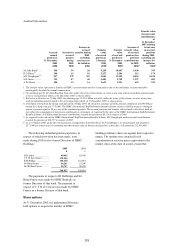
excluding goodwill amortisation) was US$0.76 and
for 2005 (now prepared under IFRSs) it was
US$1.36, representing an increase of 79 per cent.
Dividends per share have grown by 38 per cent over
the same period and the share price has risen by
51.3 per cent from 31 March 2003 to 28 February
2006. The cash return on cash invested has improved
from 12.9 per cent in 2002 to 15.7 per cent in 2005.
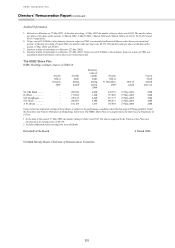
The Committee intends to undertake a review of the
appropriateness of the single TSR performance
measure for Performance Share awards made in
2003 and 2004. As part of this review the Committee
will ensure appropriate consultation is undertaken
with shareholders and their representatives.
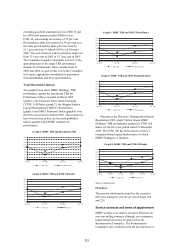
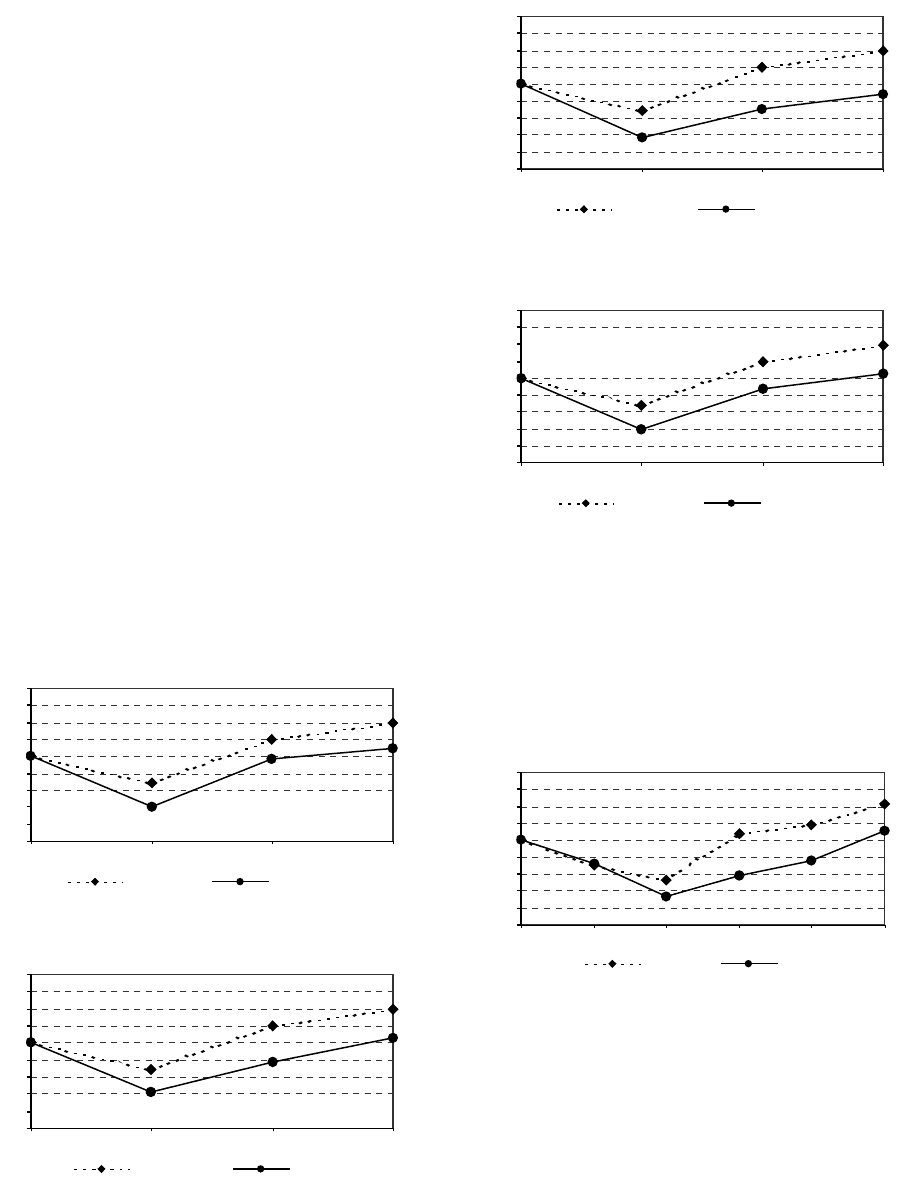
Total Shareholder Return
The graphs below show HSBC Holdings’ TSR
performance against the benchmark TSR for
Performance Shares awarded in March 2002
(graph 1), the Financial Times-Stock Exchange
(‘FTSE’) 100 Index (graph 2), the Morgan Stanley
Capital International (‘MSCI’) World Index
(graph 3) and MSCI Financials Index (graph 4) over
the three-year period to March 2005. These measures
have been chosen as they are the main published
indices against which HSBC monitors its
performance.
Graph 1: HSBC TSR and Benchmark TSR
50%
60%
70%
80%
90%
100%
110%
120%
130%
140%
Mar 2002 Mar 2003 Mar 2004 Mar 2005
HSBC TSR TSR Benc hmar k
Graph 2: HSBC TSR and FTSE 100 Index
50%
60%
70%
80%
90%
100%
110%
120%
130%
140%
Mar 2002 Mar 2003 Mar 2004 Mar 2005
HSBC TSR FTSE 100
Graph 3: HSBC TSR and MSCI World Index
50%
60%
70%
80%
90%
100%
110%
120%
130%
140%
Mar 2002 Mar 2003 Mar 2004 Mar 2005
HSBC TSR MSCI Wor ld Index
Graph 4: HSBC TSR and MSCI Financials Index
50%
60%
70%
80%
90%
100%
110%
120%
130%
140%
Mar 2002 Mar 2003 Mar 2004 Mar 2005
HSBC TSR MSCI Financ ia ls
Pursuant to the Directors’ Remuneration Report
Regulations 2002, graph 5 below shows HSBC
Holdings’ TSR performance against the FTSE 100
Index, for the five-year period ended 31 December
2005. The FTSE 100 has been chosen as this is a
recognised broad equity market index of which
HSBC Holdings is a member.
Graph 5: HSBC TSR and FTSE 100 Index
50%
60%
70%
80%
90%
100%
110%
120%
130%
140%
Dec 2000 Dec 2001 Dec 2002 Dec 2003 Dec 2004 Dec 2005
HSBC TSR FT SE 100
Source: Datastream
Pensions
The pension entitlements earned by the executive
Directors during the year are set out on pages 228
and 229.
Service contracts and terms of appointment
HSBC’s policy is to employ executive Directors on
one-year rolling contracts although, on recruitment,
longer initial terms may be approved by the
Remuneration Committee. The Remuneration
Committee will, consistent with the best interests of