HSBC 2005 Annual Report Download - page 145
Download and view the complete annual report
Please find page 145 of the 2005 HSBC annual report below. You can navigate through the pages in the report by either clicking on the pages listed below, or by using the keyword search tool below to find specific information within the annual report.-
 1
1 -
2
-
3
-
4
-
5
-
6
-
7
-
8
-
9
-
10
-
11
-
12
-
13
-
14
-
15
-
16
-
17
-
18
-
19
-
20
-
21
-
22
-
23
-
24
-
25
-
26
-
27
-
28
-
29
-
30
-
31
-
32
-
33
-
34
-
35
-
36
-
37
-
38
-
39
-
40
-
41
-
42
-
43
-
44
-
45
-
46
-
47
-
48
-
49
-
50
-
51
-
52
-
53
-
54
-
55
-
56
-
57
-
58
-
59
-
60
-
61
-
62
-
63
-
64
-
65
-
66
-
67
-
68
-
69
-
70
-
71
-
72
-
73
-
74
-
75
-
76
-
77
-
78
-
79
-
80
-
81
-
82
-
83
-
84
-
85
-
86
-
87
-
88
-
89
-
90
-
91
-
92
-
93
-
94
-
95
-
96
-
97
-
98
-
99
-
100
-
101
-
102
-
103
-
104
-
105
-
106
-
107
-
108
-
109
-
110
-
111
-
112
-
113
-
114
-
115
-
116
-
117
-
118
-
119
-
120
-
121
-
122
-
123
-
124
-
125
-
126
-
127
-
128
-
129
-
130
-
131
-
132
-
133
-
134
-
 135
135 -
 136
136 -
 137
137 -
 138
138 -
 139
139 -
 140
140 -
 141
141 -
 142
142 -
 143
143 -
 144
144 -
 145
145 -
 146
146 -
 147
147 -
 148
148 -
 149
149 -
 150
150 -
 151
151 -
 152
152 -
 153
153 -
 154
154 -
 155
155 -
156
-
157
-
158
-
159
-
160
-
161
-
162
-
163
-
164
-
165
-
166
-
167
-
168
-
169
-
170
-
171
-
172
-
173
-
174
-
175
-
176
-
177
-
178
-
179
-
180
-
181
-
182
-
183
-
184
-
185
-
186
-
187
-
188
-
189
-
190
-
191
-
192
-
193
-
194
-
195
-
196
-
197
-
198
-
199
-
200
-
201
-
202
-
203
-
204
-
205
-
206
-
207
-
208
-
209
-
210
-
211
-
212
-
213
-
214
-
215
-
216
-
217
-
218
-
219
-
220
-
221
-
222
-
223
-
224
-
225
-
226
-
227
-
228
-
229
-
230
-
231
-
232
-
233
-
234
-
235
-
236
-
237
-
238
-
239
-
240
-
241
-
242
-
243
-
244
-
245
-
246
-
247
-
248
-
249
-
250
-
251
-
252
-
253
-
254
-
255
-
256
-
257
-
258
-
259
-
260
-
261
-
262
-
263
-
264
-
265
-
266
-
267
-
268
-
269
-
270
-
271
-
272
-
273
-
274
-
275
-
276
-
277
-
278
-
279
-
280
-
281
-
282
-
283
-
284
-
285
-
286
-
287
-
288
-
289
-
290
-
291
-
292
-
293
-
294
-
295
-
296
-
297
-
298
-
299
-
300
-
301
-
302
-
303
-
304
-
305
-
306
-
307
-
308
-
309
-
310
-
311
-
312
-
313
-
314
-
315
-
316
-
317
-
318
-
319
-
320
-
321
-
322
-
323
-
324
-
325
-
326
-
327
-
328
-
329
-
330
-
331
-
332
-
333
-
334
-
335
-
336
-
337
-
338
-
339
-
340
-
341
-
342
-
343
-
344
-
345
-
346
-
347
-
348
-
349
-
350
-
351
-
352
-
353
-
354
-
355
-
356
-
357
-
358
-
359
-
360
-
361
-
362
-
363
-
364
-
365
-
366
-
367
-
368
-
369
-
370
-
371
-
372
-
373
-
374
-
375
-
376
-
377
-
378
-
379
-
380
-
381
-
382
-
383
-
384
-
385
-
386
-
387
-
388
-
389
-
390
-
391
-
392
-
393
-
394
-
395
-
396
-
397
-
398
-
399
-
400
-
401
-
402
-
403
-
404
-
405
-
406
-
407
-
408
-
409
-
410
-
411
-
412
-
413
-
414
-
415
-
416
-
417
-
418
-
419
-
420
-
421
-
422
-
423
-
424
 |
 |

143
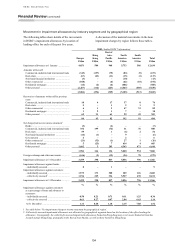
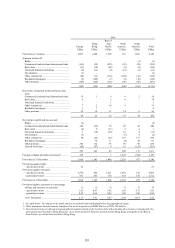
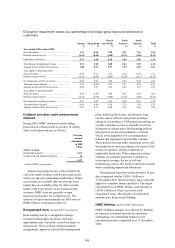
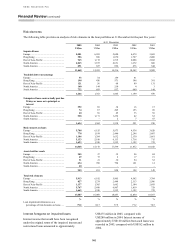
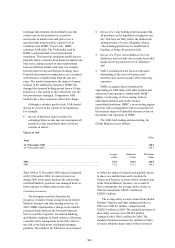
Charge for impairment losses as a percentage of average gross loans and advances to
customers
Europe
%
Hong Kong
%
Rest o
f
Asia-Pacific
%
North
America
%
South
America
%
Total
%
Year ended 31 December 2005
New allowances .................................................. 1.12 0.44 0.70 2.25 7.68 1.50
Releases and recoveries ....................................... (0.39) (0.26) (0.50) (0.21) (1.80) (0.34)
Impairment allowances ....................................... 0.73 0.18 0.20 2.04 5.88 1.16
Total charge for impairment losses ..................... 0.73 0.18 0.20 2.04 5.89 1.16
Amount written off net of recoveries .................. 1.00 0.31 0.37 1.99 4.49 1.26
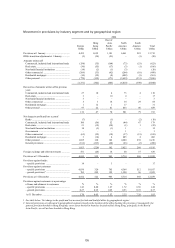
Year ended 31 December 2004
New provisions ................................................... 0.78 0.31 0.77 2.54 6.58 1.41
Releases and recoveries ...................................... (0.33) (0.30) (0.49) (0.30) (2.13) (0.35)
Net charge for specific provisions ...................... 0.45 0.01 0.28 2.24 4.45 1.06
Total provisions charged .................................... 0.39 (0.29) 0.19 2.21 4.45 0.99
Amount written off net of recoveries .................. 0.46 0.33 0.61 2.56 5.27 1.26
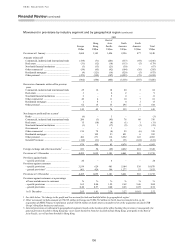
Year ended 31 December 2003
New provisions ................................................... 0.76 0.89 0.96 2.91 6.09 1.60
Releases and recoveries ...................................... (0.25) (0.30) (0.80) (0.25) (1.88) (0.32)
Net charge for specific provisions ...................... 0.51 0.59 0.16 2.66 4.21 1.28
Total provisions charged .................................... 0.45 0.54 0.20 2.74 1.34 1.25
Amount written off net of recoveries .................. 0.39 0.73 0.86 2.93 3.94 1.40
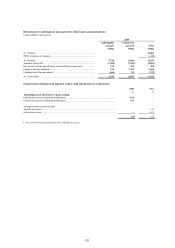
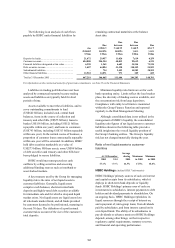
Collateral and other credit enhancements
obtained
During 2005, HSBC obtained assets by taking
possession of collateral held as security, or calling
other credit enhancements, as follows:
Carrying
amount
obtainable
in 20051
US$m
Nature of assets
Residential property ................................. 1,171
Commercial and industrial property ........ 26
1,197
1 Audited IFRS 7 information.
Repossessed properties are made available for
sale in an orderly fashion, with the proceeds used to
reduce or repay the outstanding indebtedness. Where
excess funds are available after the debt has been
repaid, they are available either for other secured
lenders with lower priority or are returned to the
customer. HSBC does not generally occupy
repossessed properties for its business use. The
majority of repossessed properties in 2005 arose in
HSBC Finance Corporation in the US.
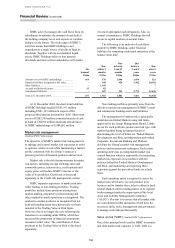
Renegotiated loans (Audited IFRS 7 information)
Restructuring activity is designed to manage
customer relationships, maximise collection
opportunities and, if possible, avoid foreclosure or
repossession. These include extended payment
arrangements, approved external debt management
plans, deferring foreclosure, modification, loan
rewrites and/or deferral of payments pending a
change in circumstances. Following restructuring, an
overdue consumer account is normally reset from
delinquent to current status. Restructuring policies
and practices are based on indicators or criteria
which, in the judgement of local management,
indicate that repayment will probably continue.
These policies are kept under continuous review and
their application varies according to the nature of the
market, the product, and the availability of
empirically based data. When empirical evidence
indicates an increased propensity to default on
restructured accounts, the use of roll-rate
methodology ensures this factor is taken into account
when calculating impairment allowances.
Renegotiated loans that would otherwise be past
due or impaired totalled US$18.1 billion at
31 December 2005. Restructuring is most commonly
applied to consumer finance portfolios. The largest
concentration is in HSBC Finance, and amounts to
US$14.8 billion or 82 per cent of the total
renegotiated loans. The majority of restructured
amounts arise from secured lending.
HSBC Holdings (Audited IFRS 7 information)
HSBC Holdings manages its credit risk by limiting
its exposure to transactions with its subsidiary
undertakings. No outstanding balances were
considered past due or impaired as at 31 December
2005.