HSBC 2005 Annual Report Download - page 148
Download and view the complete annual report
Please find page 148 of the 2005 HSBC annual report below. You can navigate through the pages in the report by either clicking on the pages listed below, or by using the keyword search tool below to find specific information within the annual report.-
 1
1 -
2
-
3
-
4
-
5
-
6
-
7
-
8
-
9
-
10
-
11
-
12
-
13
-
14
-
15
-
16
-
17
-
18
-
19
-
20
-
21
-
22
-
23
-
24
-
25
-
26
-
27
-
28
-
29
-
30
-
31
-
32
-
33
-
34
-
35
-
36
-
37
-
38
-
39
-
40
-
41
-
42
-
43
-
44
-
45
-
46
-
47
-
48
-
49
-
50
-
51
-
52
-
53
-
54
-
55
-
56
-
57
-
58
-
59
-
60
-
61
-
62
-
63
-
64
-
65
-
66
-
67
-
68
-
69
-
70
-
71
-
72
-
73
-
74
-
75
-
76
-
77
-
78
-
79
-
80
-
81
-
82
-
83
-
84
-
85
-
86
-
87
-
88
-
89
-
90
-
91
-
92
-
93
-
94
-
95
-
96
-
97
-
98
-
99
-
100
-
101
-
102
-
103
-
104
-
105
-
106
-
107
-
108
-
109
-
110
-
111
-
112
-
113
-
114
-
115
-
116
-
117
-
118
-
119
-
120
-
121
-
122
-
123
-
124
-
125
-
126
-
127
-
128
-
129
-
130
-
131
-
132
-
133
-
134
-
135
-
136
-
137
-
 138
138 -
 139
139 -
 140
140 -
 141
141 -
 142
142 -
 143
143 -
 144
144 -
 145
145 -
 146
146 -
 147
147 -
 148
148 -
 149
149 -
 150
150 -
 151
151 -
 152
152 -
 153
153 -
 154
154 -
 155
155 -
 156
156 -
 157
157 -
 158
158 -
159
-
160
-
161
-
162
-
163
-
164
-
165
-
166
-
167
-
168
-
169
-
170
-
171
-
172
-
173
-
174
-
175
-
176
-
177
-
178
-
179
-
180
-
181
-
182
-
183
-
184
-
185
-
186
-
187
-
188
-
189
-
190
-
191
-
192
-
193
-
194
-
195
-
196
-
197
-
198
-
199
-
200
-
201
-
202
-
203
-
204
-
205
-
206
-
207
-
208
-
209
-
210
-
211
-
212
-
213
-
214
-
215
-
216
-
217
-
218
-
219
-
220
-
221
-
222
-
223
-
224
-
225
-
226
-
227
-
228
-
229
-
230
-
231
-
232
-
233
-
234
-
235
-
236
-
237
-
238
-
239
-
240
-
241
-
242
-
243
-
244
-
245
-
246
-
247
-
248
-
249
-
250
-
251
-
252
-
253
-
254
-
255
-
256
-
257
-
258
-
259
-
260
-
261
-
262
-
263
-
264
-
265
-
266
-
267
-
268
-
269
-
270
-
271
-
272
-
273
-
274
-
275
-
276
-
277
-
278
-
279
-
280
-
281
-
282
-
283
-
284
-
285
-
286
-
287
-
288
-
289
-
290
-
291
-
292
-
293
-
294
-
295
-
296
-
297
-
298
-
299
-
300
-
301
-
302
-
303
-
304
-
305
-
306
-
307
-
308
-
309
-
310
-
311
-
312
-
313
-
314
-
315
-
316
-
317
-
318
-
319
-
320
-
321
-
322
-
323
-
324
-
325
-
326
-
327
-
328
-
329
-
330
-
331
-
332
-
333
-
334
-
335
-
336
-
337
-
338
-
339
-
340
-
341
-
342
-
343
-
344
-
345
-
346
-
347
-
348
-
349
-
350
-
351
-
352
-
353
-
354
-
355
-
356
-
357
-
358
-
359
-
360
-
361
-
362
-
363
-
364
-
365
-
366
-
367
-
368
-
369
-
370
-
371
-
372
-
373
-
374
-
375
-
376
-
377
-
378
-
379
-
380
-
381
-
382
-
383
-
384
-
385
-
386
-
387
-
388
-
389
-
390
-
391
-
392
-
393
-
394
-
395
-
396
-
397
-
398
-
399
-
400
-
401
-
402
-
403
-
404
-
405
-
406
-
407
-
408
-
409
-
410
-
411
-
412
-
413
-
414
-
415
-
416
-
417
-
418
-
419
-
420
-
421
-
422
-
423
-
424
 |
 |

HSBC HOLDINGS PLC
Financial Review (continued)
146
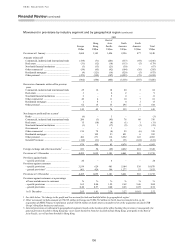
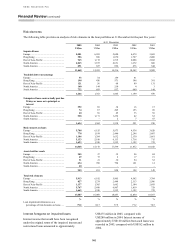
Risk elements in the loan portfolio
The disclosure of credit risk elements under the
following headings reflects US accounting practice
and classifications:
• loans accounted for on a non-accrual basis;
• accruing loans contractually past due 90 days or
more as to interest or principal; and
• troubled debt restructurings not included in the
above.
In accordance with IFRSs, interest income
continues to be recognised on assets that have been
written down as a result of an impairment loss. In the
following tables, HSBC presents information on its
impaired loans and advances which are designated in
accordance with the policy described above.
Impaired loans are consistent with the ‘non-
accrual basis’ classification used in US GAAP and in
prior years.
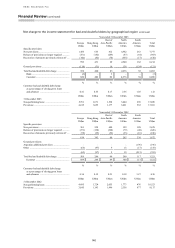
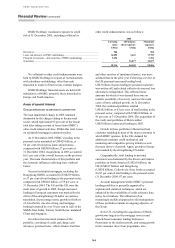
Impaired loans and advances
At 31 December
2005
US$m
2004
US$m
Banks .............................................................................................................................................. 22 26
Customers ....................................................................................................................................... 11,446 12,427
Total impaired loans and advances ................................................................................................. 11,468 12,453
Total allowances cover as a percentage of impaired loans and advances ........................................ 99.1% 100.9%
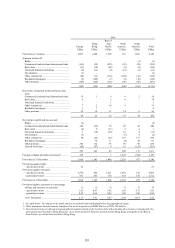
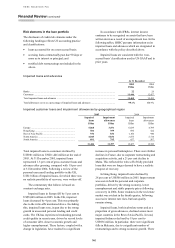
Impaired customer loans and impairment allowances by geographical region
2005 2004
Impaired
loans
Impairment
allowances
Impaired
loans
Impairment
allowances
US$m US$m US$m US$m
Europe ......................................................................... 5,068 3,491 6,039 4,799
Hong Kong .................................................................. 506 399 696 522
Rest of Asia-Pacific ..................................................... 936 836 1,160 940
North America ............................................................. 4,045 5,836 3,875 5,714
South America ............................................................. 891 795 657 567
11,446 11,357 12,427 12,542
Total impaired loans to customers declined by
US$981 million to US$11,446 million at the end of
2005. At 31 December 2005, impaired loans
represented 1.5 per cent of gross customer loans and
advances after grossing, compared with 1.8 per cent
at 31 December 2004. Following a review of the
personal unsecured lending portfolio in the UK,
US$1 billion of impaired loans, for which there was
no realistic possibility of recovery, were written-off.
The commentary that follows is based on
constant exchange rates.
Impaired loans in Europe fell by 5 per cent to
US$5,068 million in 2005. In the UK, impaired
loans decreased by 4 per cent. This was primarily
due to the write-offs mentioned above. Excluding
this, impaired loans rose, in part due to the strong
growth in unsecured personal lending and credit
cards. The UK has experienced weakening personal
credit quality in recent years, driven by record levels
of consumer debt, slower economic growth and
higher unemployment. These factors, coupled with a
change in legislation, have resulted in a significant
increase in personal bankruptcies. There were further
declines in France, due to corporate restructuring and
acquisition activity, and a 21 per cent decline in
Malta. This reflected the write-off of fully provided
loans that were no longer deemed to have a realistic
prospect of recovery.
In Hong Kong, impaired loans declined by
28 per cent to US$506 million in 2005. Improvement
was seen in both the personal and corporate
portfolios, driven by the strong economy, lower
unemployment and stable property prices following
a recovery in 2004. Some weakness in the real estate
market was evident in the fourth quarter, following
successive interest rate rises, but loan quality
remains strong.
Impaired loans, both in absolute terms and as a
proportion of gross advances, declined across most
major countries in the Rest of Asia-Pacific. In total,
impaired balances declined by 19 per cent to
US$936 million. In particular, there were significant
falls in Malaysia, due to a significant number of
restructurings and to strong economic growth. There